This EcoFlow power station with the solar PV input on port 2 is located in my basement office. The solar array is located on a temporary rack on the upstairs deck.

The electrical load on the EcoFlow unit is my workstation desktop which is connected to 3 large displays and some other electronic devices are connected to the EcoFlow unit. I have a Particle Photon monitoring the power being used by the workstation with 2-3 updates per second. The load on the EcoFlow varies from about 25 to 550 Watts depending upon the day, time and screen connectivity and activity.
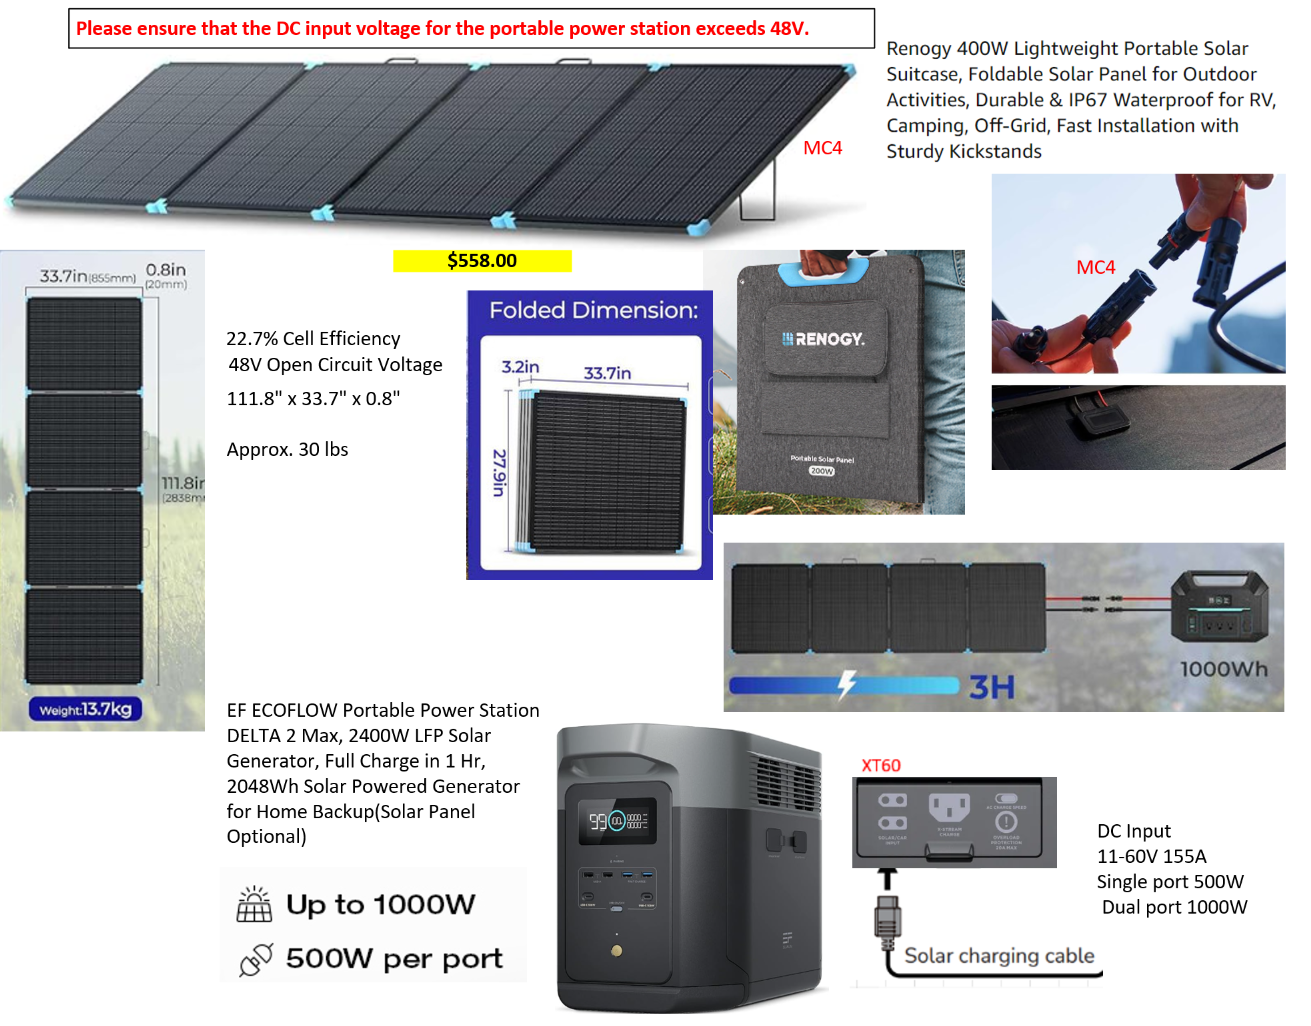
Here’s an example of the load on a typical workday. Power varies due to screen color and screen updates on the three large displays, a high load day.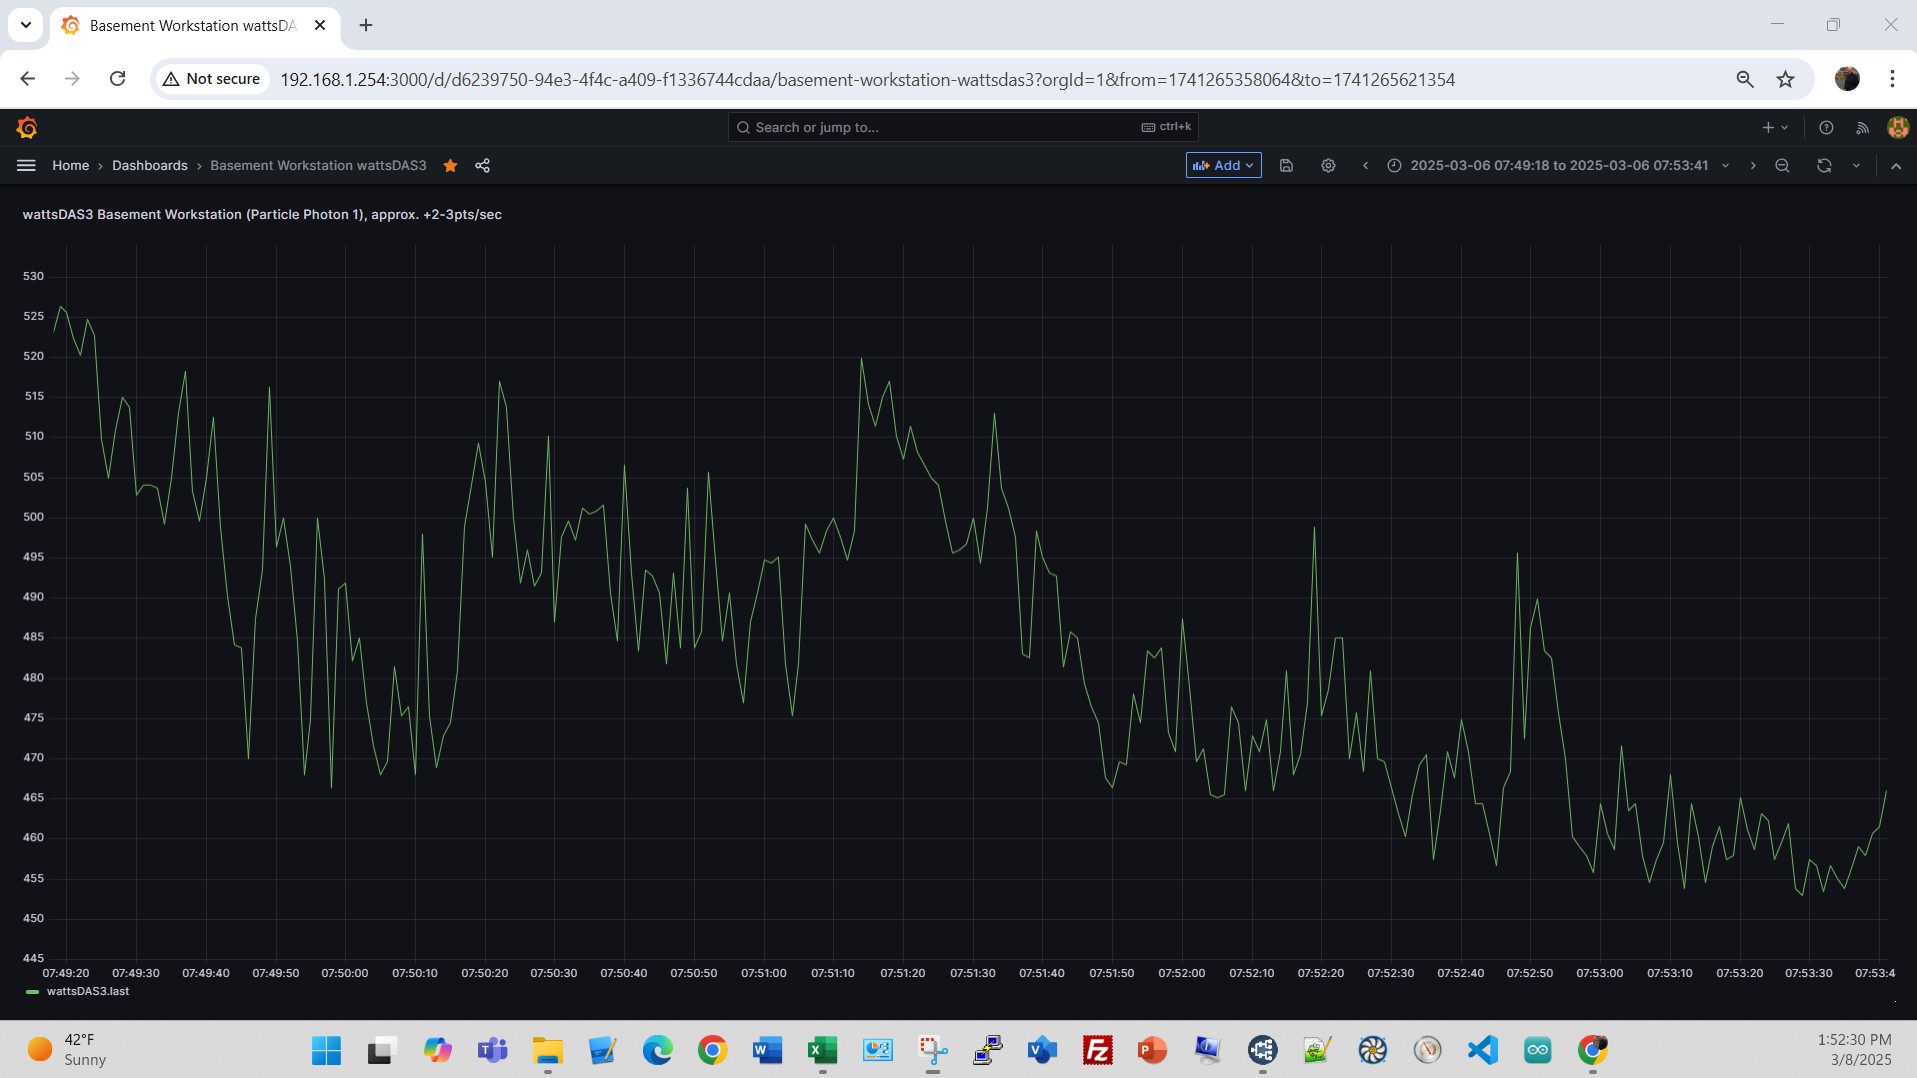 An example for a non-workday, just some RPi’s, NUC and Dell Edge running, a low load day.
 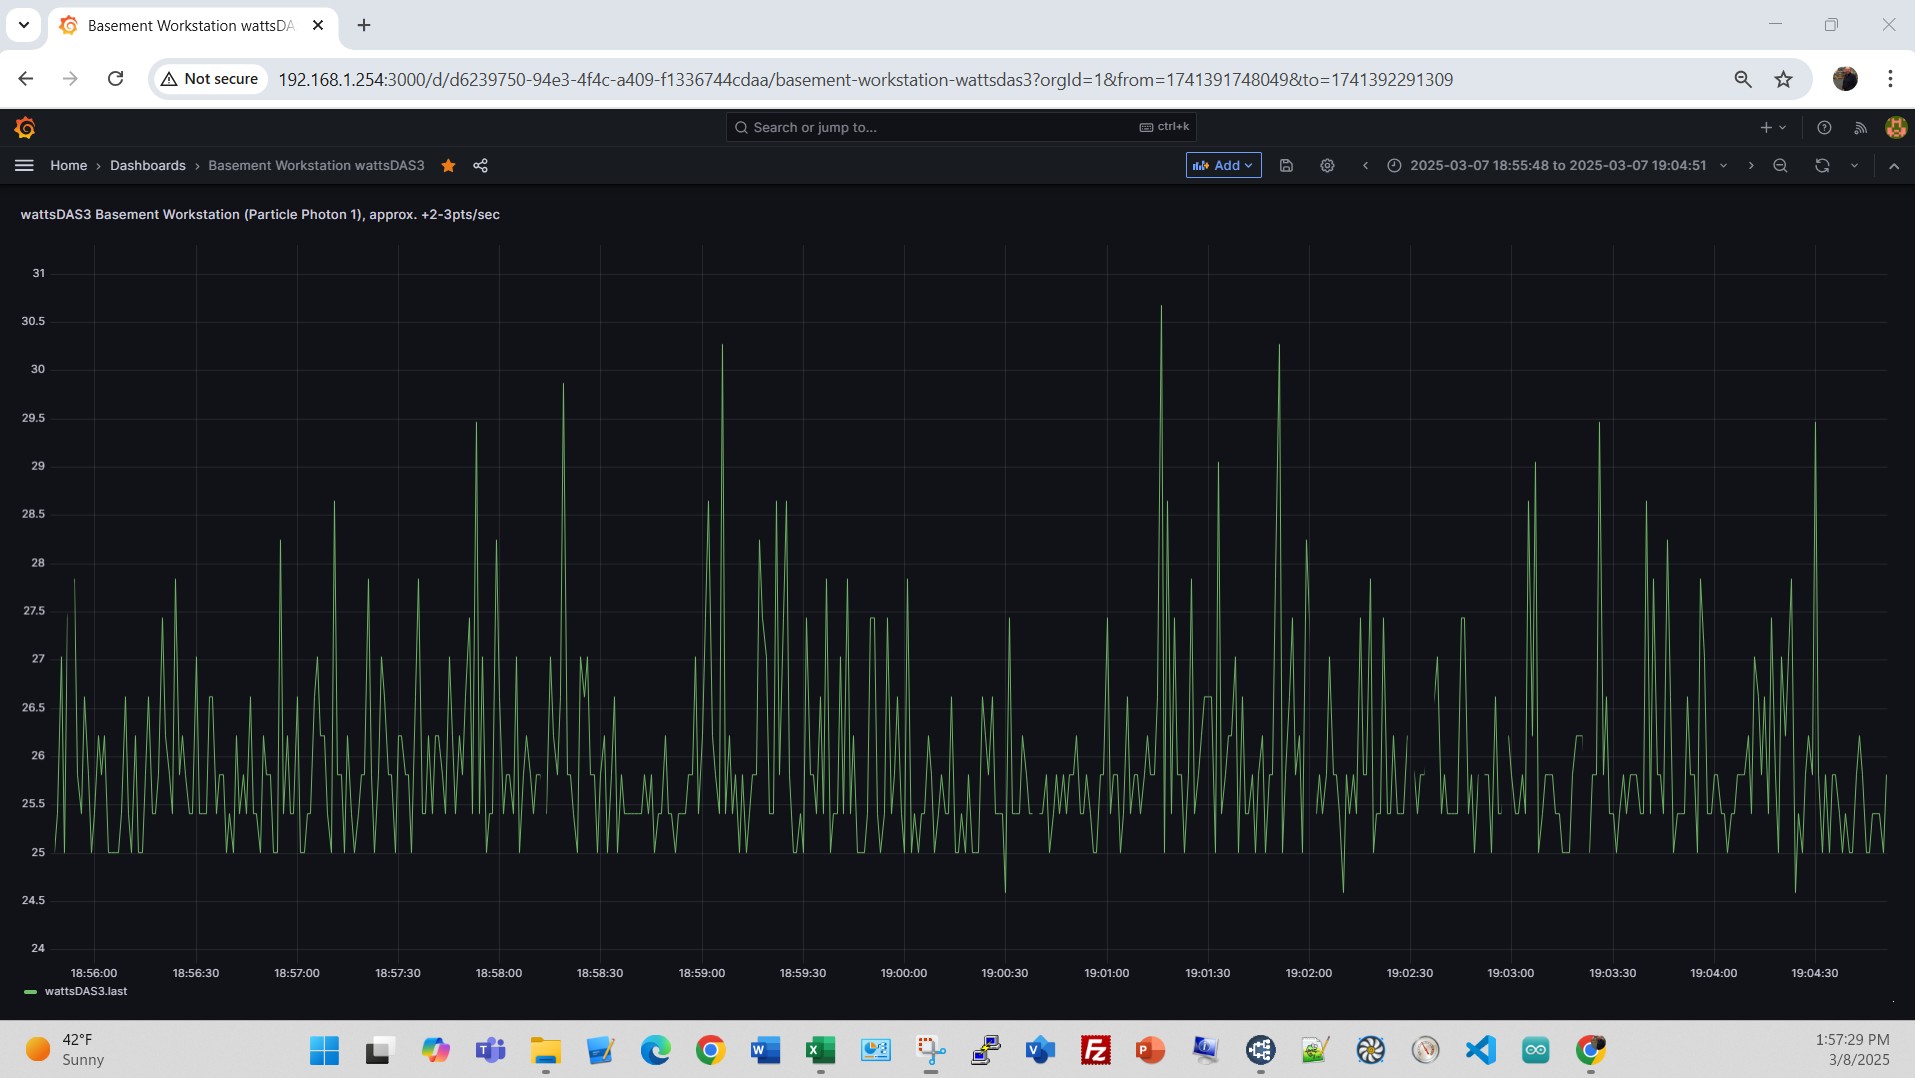 Here’s a view of the Renogy 400W solar PV setup on the rear deck, on a snowy day 02/09/25, before and after removing the snow cover. Note the blue dashed line on PV Watts at 09:37A when the snow cover was removed from the array. Look closer at the time between 09:37 and 10:00. Power output before snow removal 20W, after snow removal 60W, even as solar radiation dropped a bit. At 10:00A sun peaked to 387 W/m2 and PV output climbed to 217W.
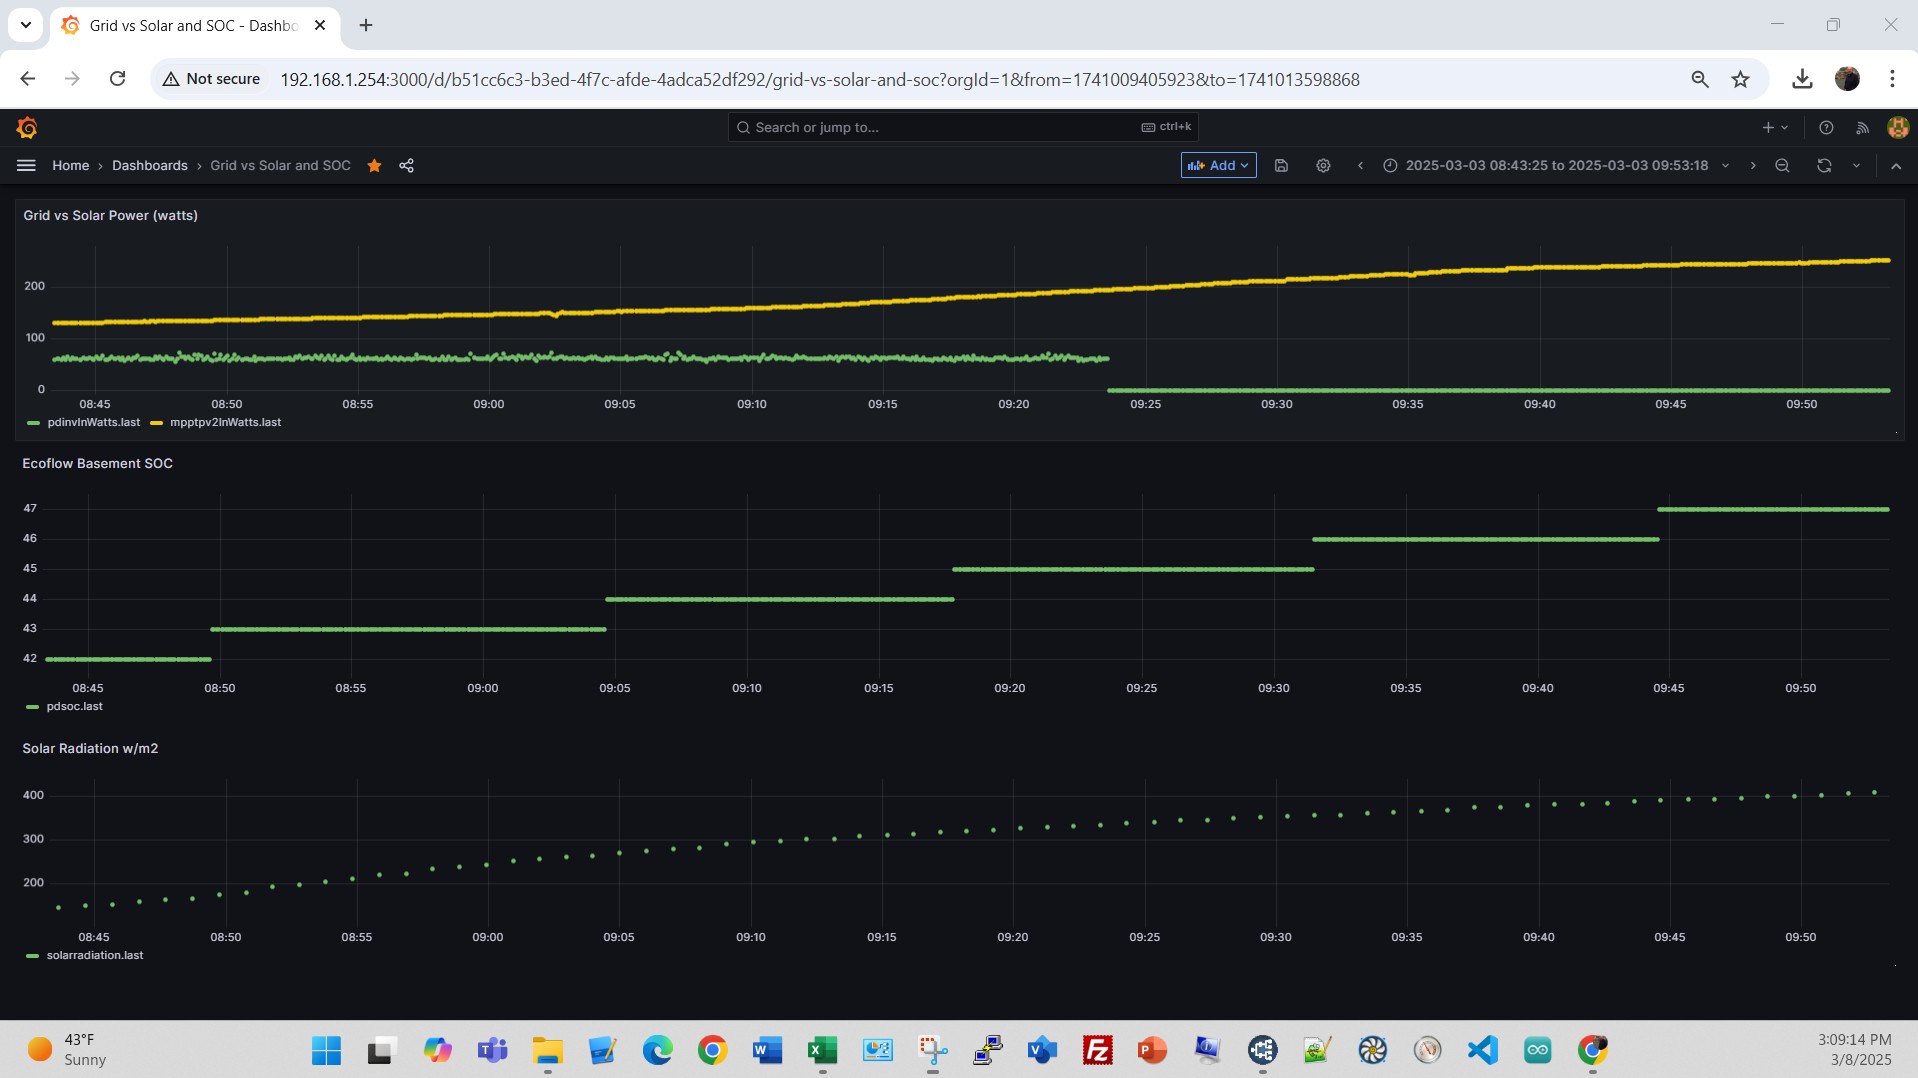
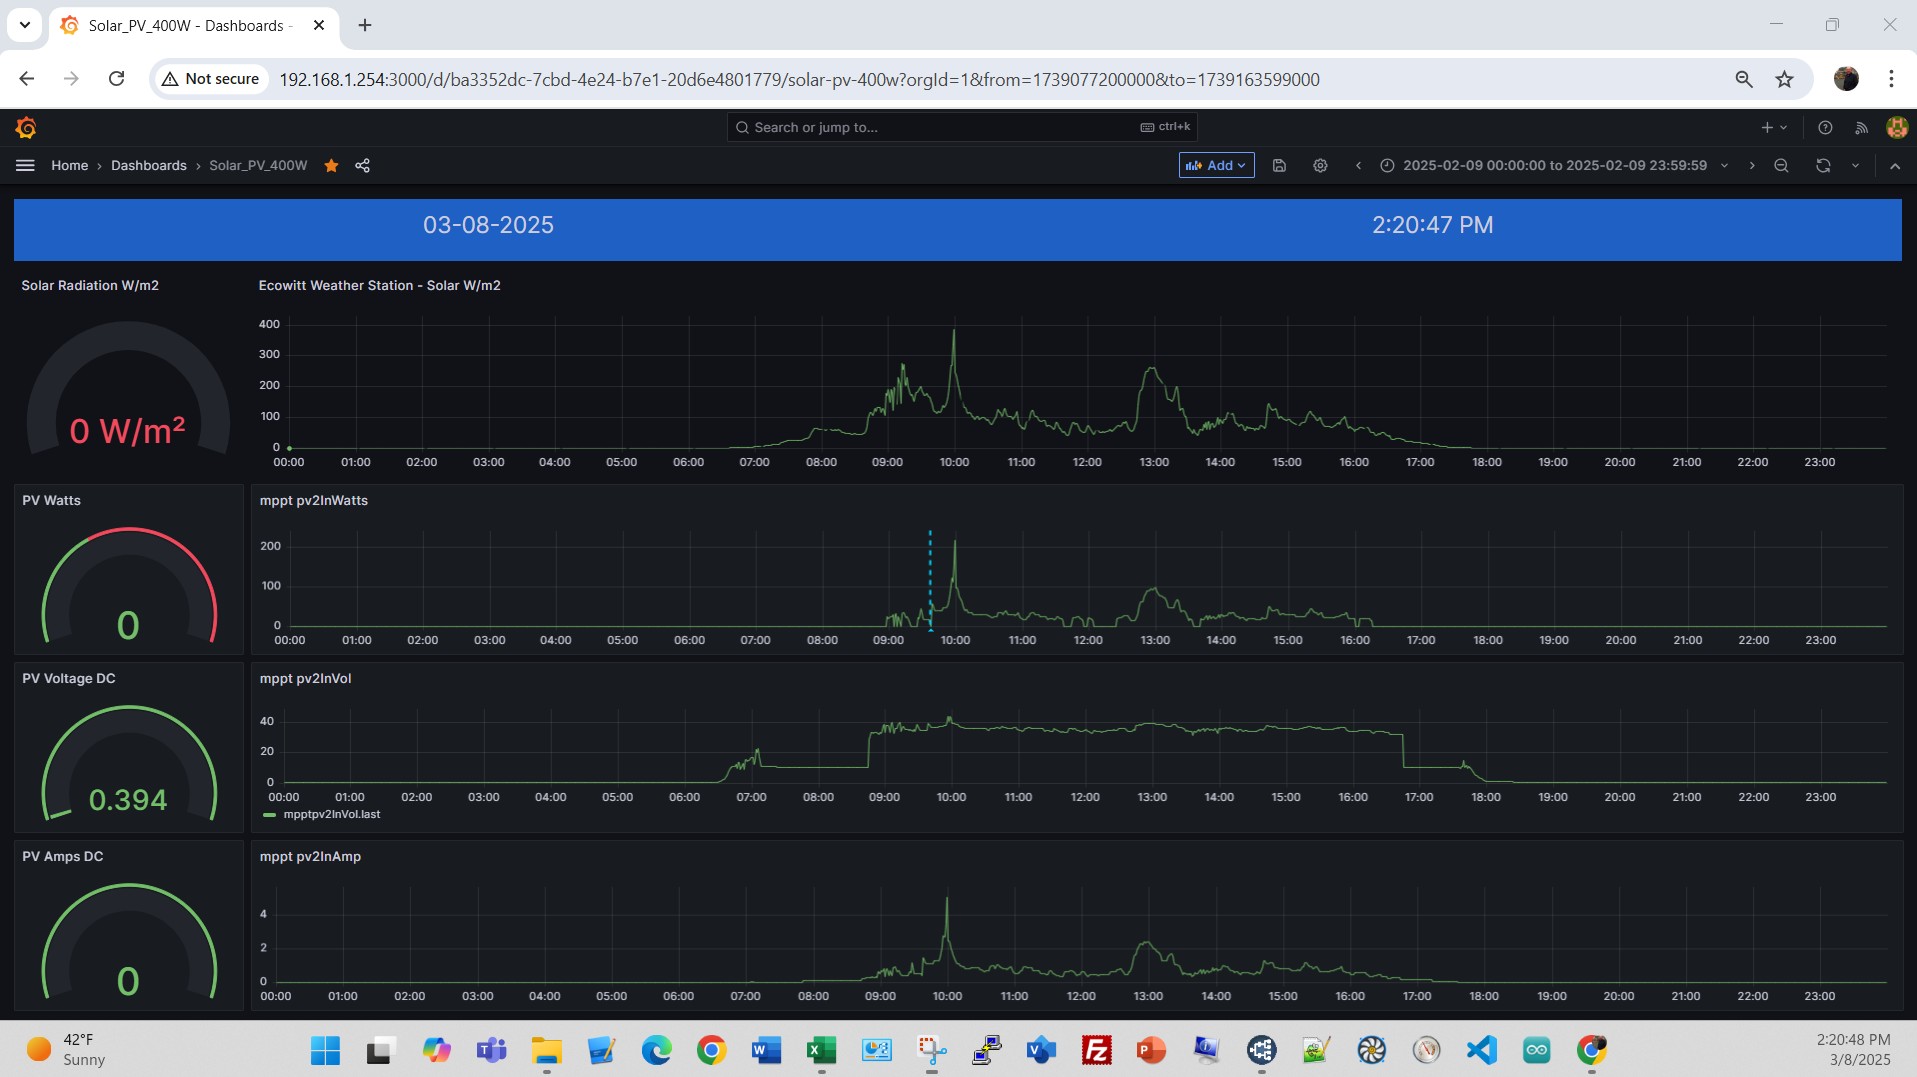 Looking at the interaction of the EcoFlow, SolarPV, grid input, electrical load and State of Charge (SOC).An on a sunny day 03/07/25, note the near perfect bell curve for solar radiation in the bottom graph. You can see the EcoFlow State of Charge climb all day and max at near 100% at 1:50PM. Looking at 03/03/25, with the minimum SOC set at 40%, the SOC had to get to 45% before stopping the Grid input on a day with a low load.
 Zoom in on 03/06/25, with the minimum SOC set at 40%, looks like the SOC had to get to 60% at 11:20A before stopping, and 45% at 12:58P before stopping the Gird input on a day with a high load. Also note that between 11:20A and 12:20P the EcoFlow powered the load completely during this time from battery and solar. It also was able to do this from 12:57P to 1:15P.