This posting is a continuation of the Gas Boiler Efficiency Monitoring project. The goal for this work was to build a system to monitor the status of the natural gas burner on the hot water boiler, track runtime and estimate natural gas use in therms (Equivalent: 100,000 BTU, or 100 cubic feet of natural gas), then in real-time continuously display the usage so far this month and then project the estimated monthly gas use and costs. Ultimately, to get to a display something like this on another Arduino NANO with a 128×64 OLED I2C screen.

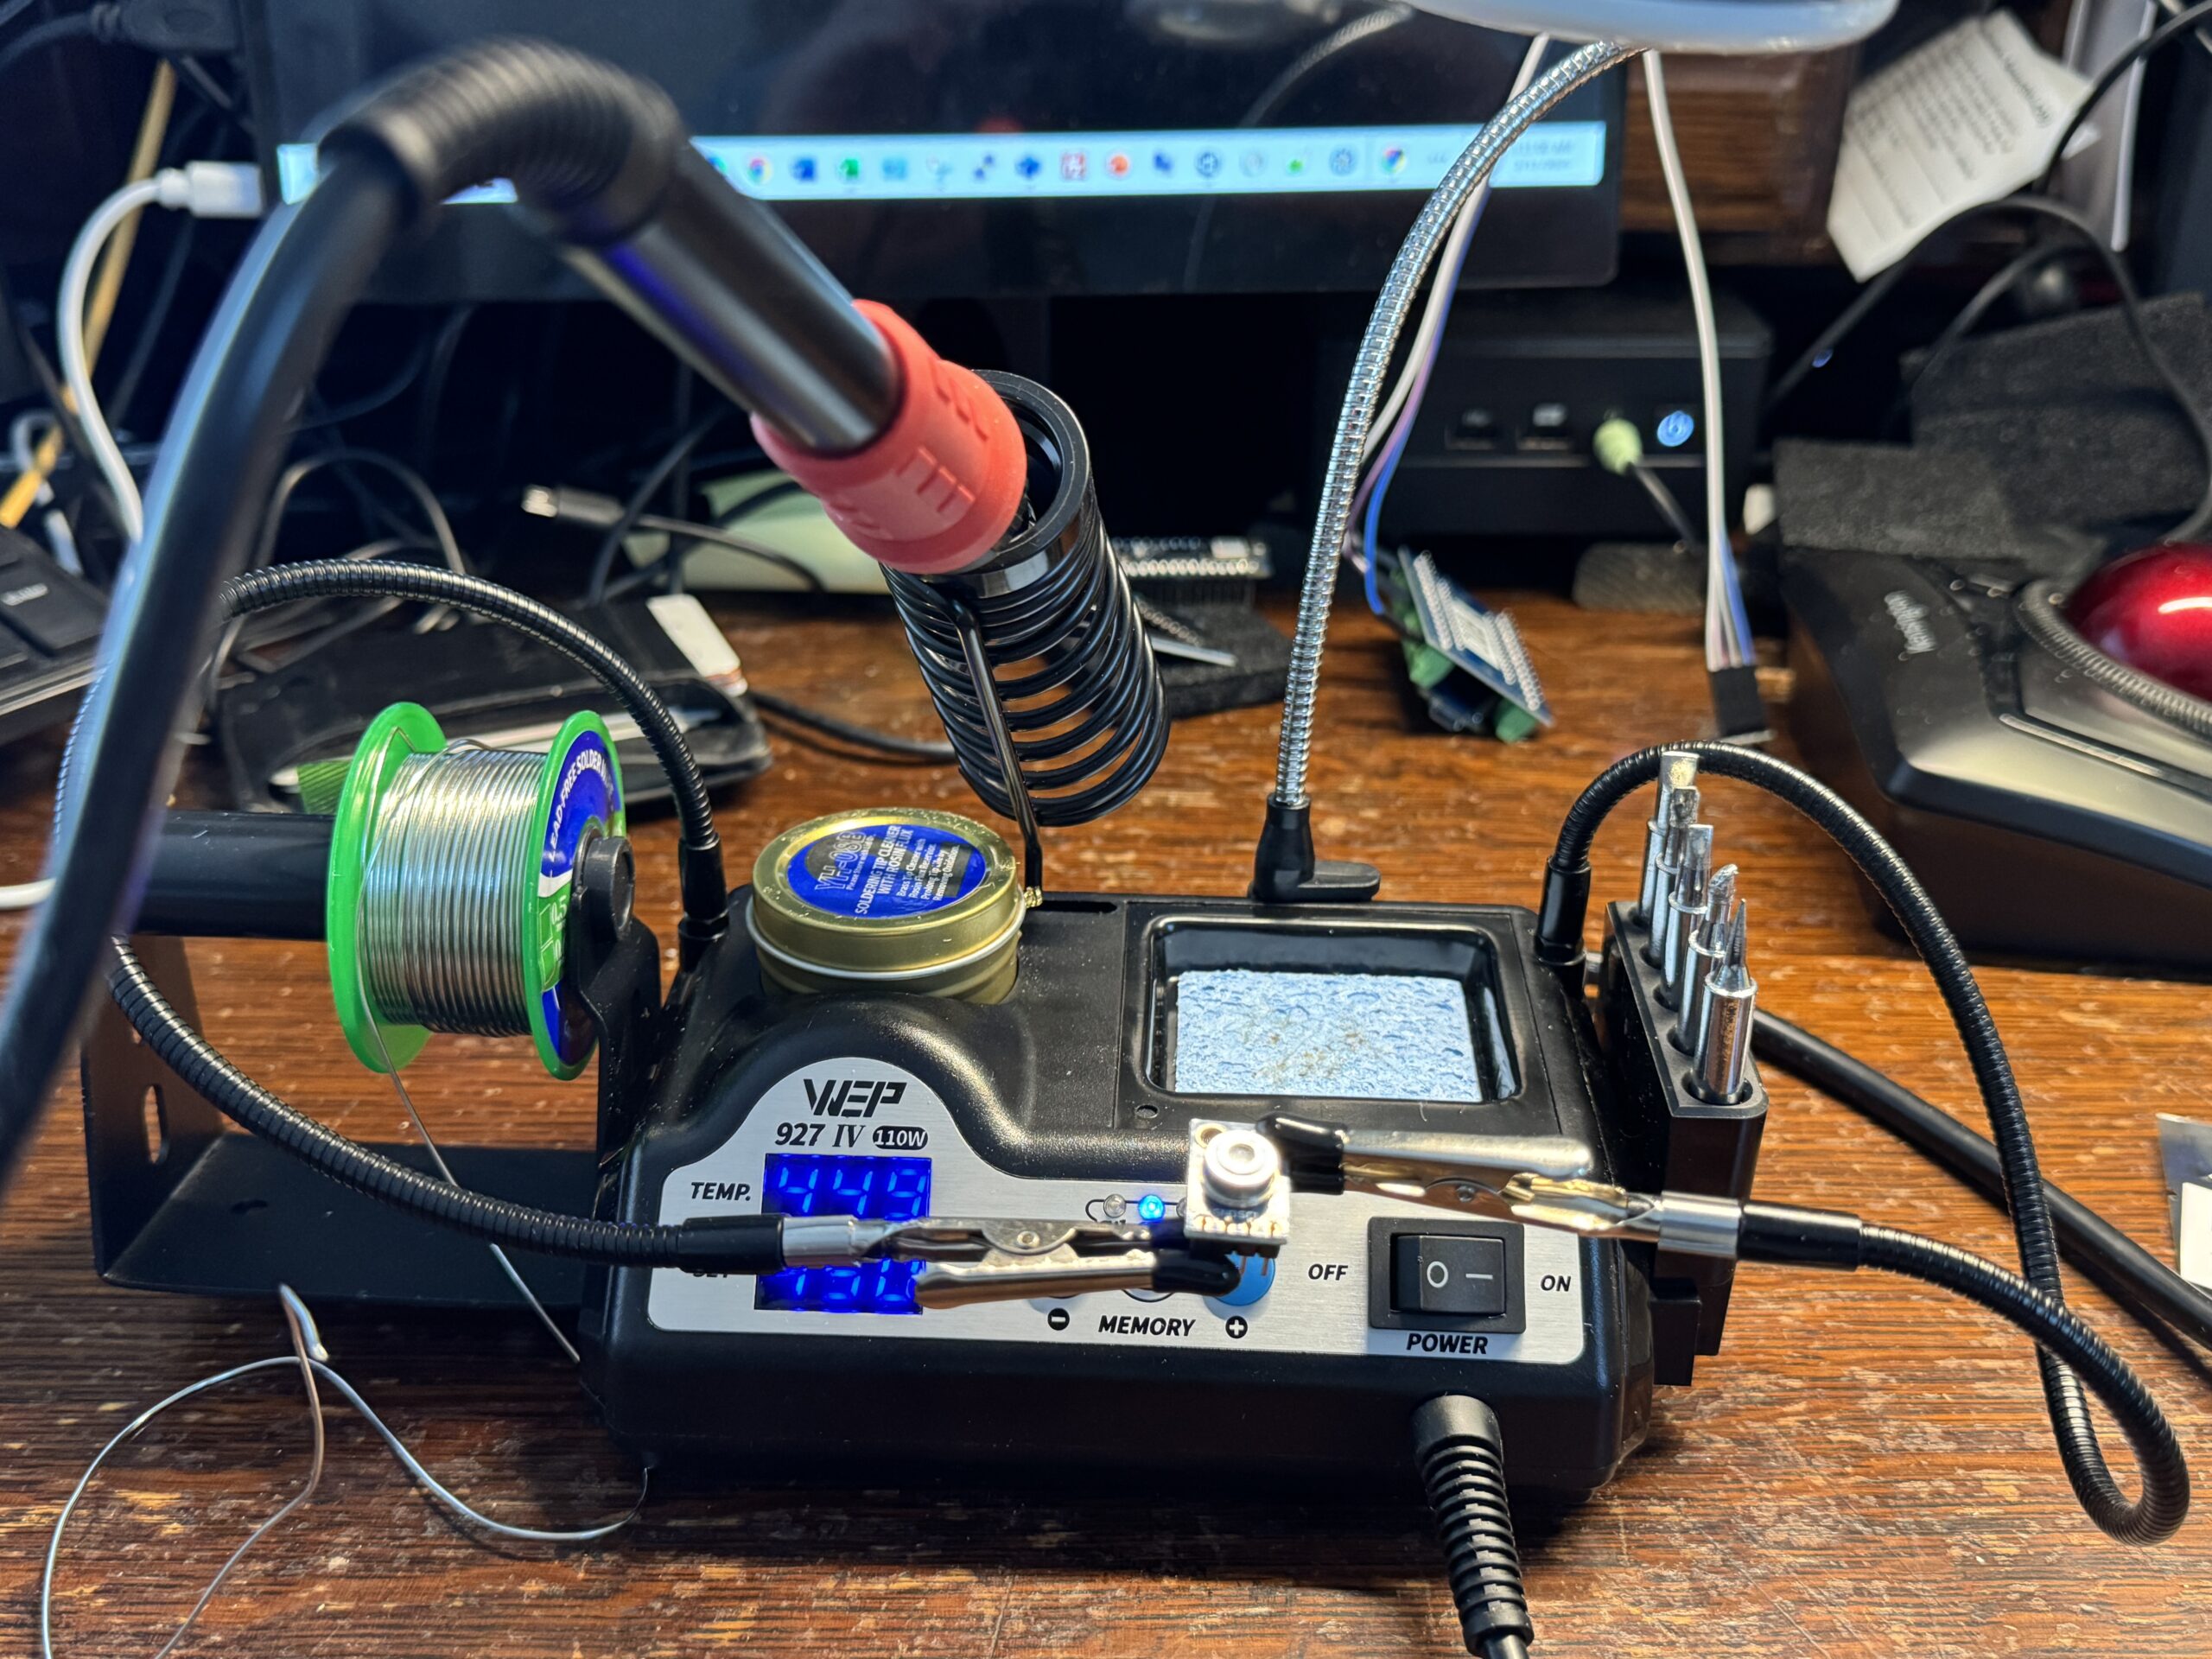
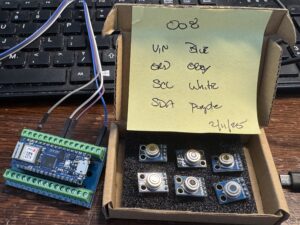
I was looking for better and easier way to determine if the natural gas burner was operating instead of using a CAD sensor aimed at the burner box. The CAD cell can be influenced by ambient light when the burner is not operating and over an extended period of time it could be affected by proximity to the natural gas burner box. So I looked for infrared sensors that would work with the Arduino NANO. I came across these I2C devices that would need to be soldered. I hadn’t done any of that in a long time.
The next step was to figure out how to connect this IR temperature sensor to the NANO. I used a NANO 33 IOT drawing from the Arduino website as a background, and overlaid the additional information in Visio that I would need to make the connections as shown below.

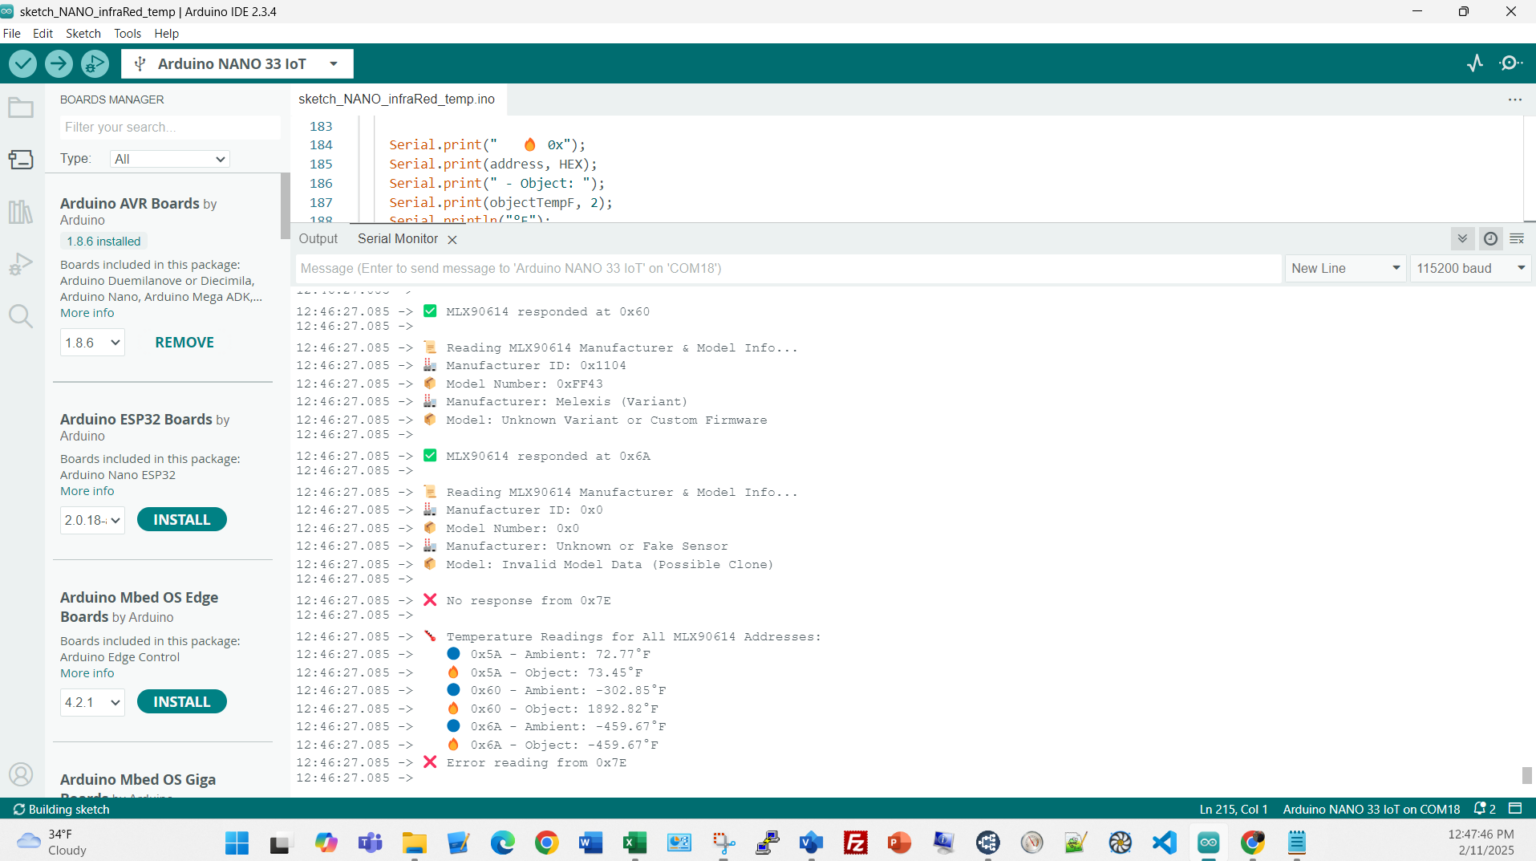
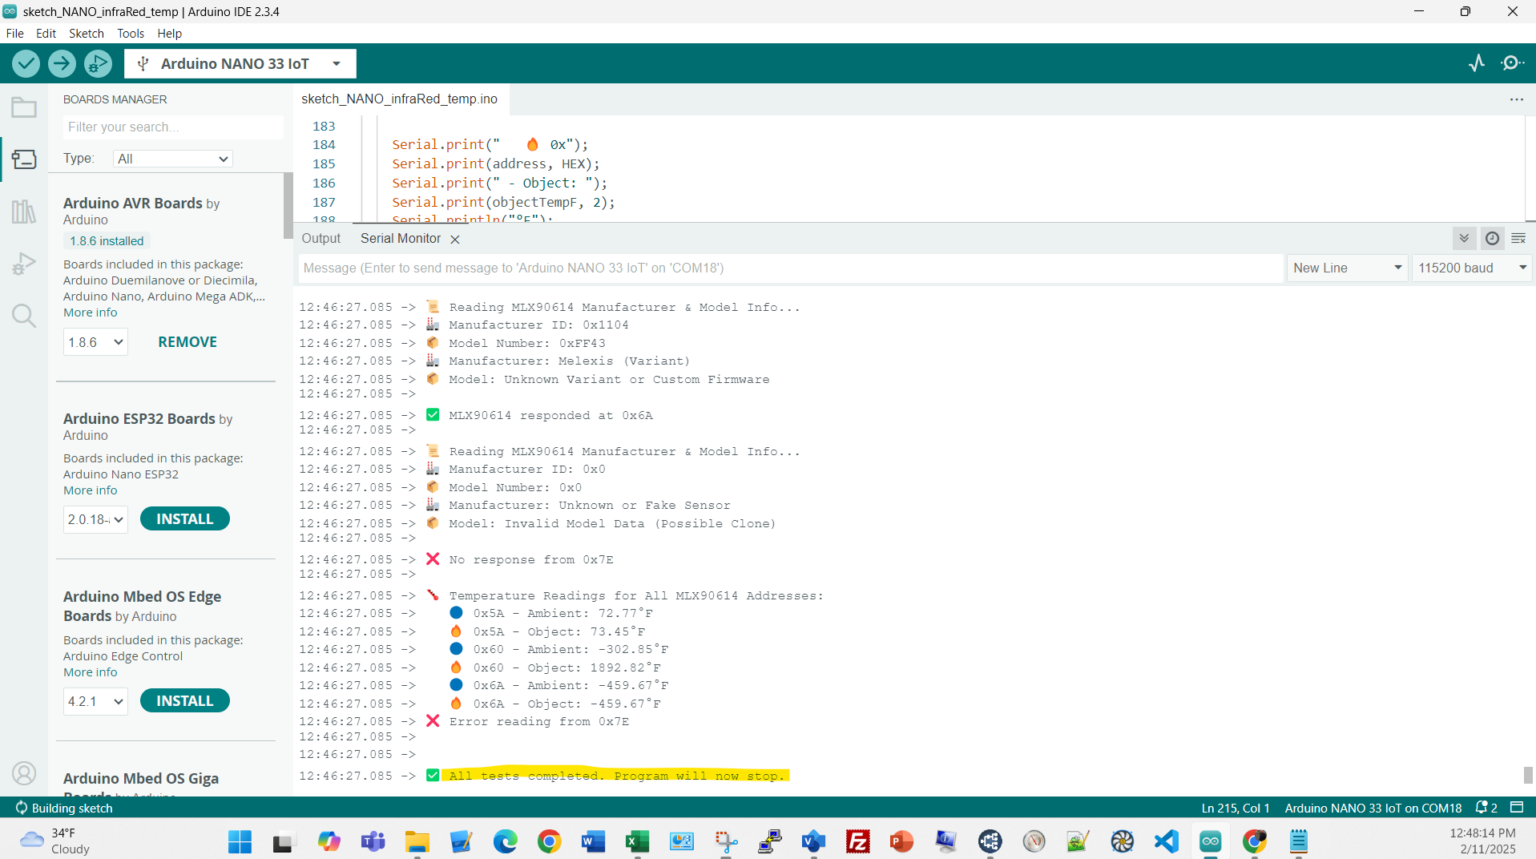
The next step was some programming, ChatGPT helped a lot with that, but part of the problem was that I needed to bench test the sensors after soldering, to make sure they worked properly, so I wound up building and dedicating a NANO to IR testing as shown in the Arduino IDE serial console screens below.
This took quite a few interactive coding sessions with ChatGPT to get the information and diagnostics that I wanted, such as identifying the mfg, model, I2C address, clock speed, ambient and object temperatures as shown on the following screens.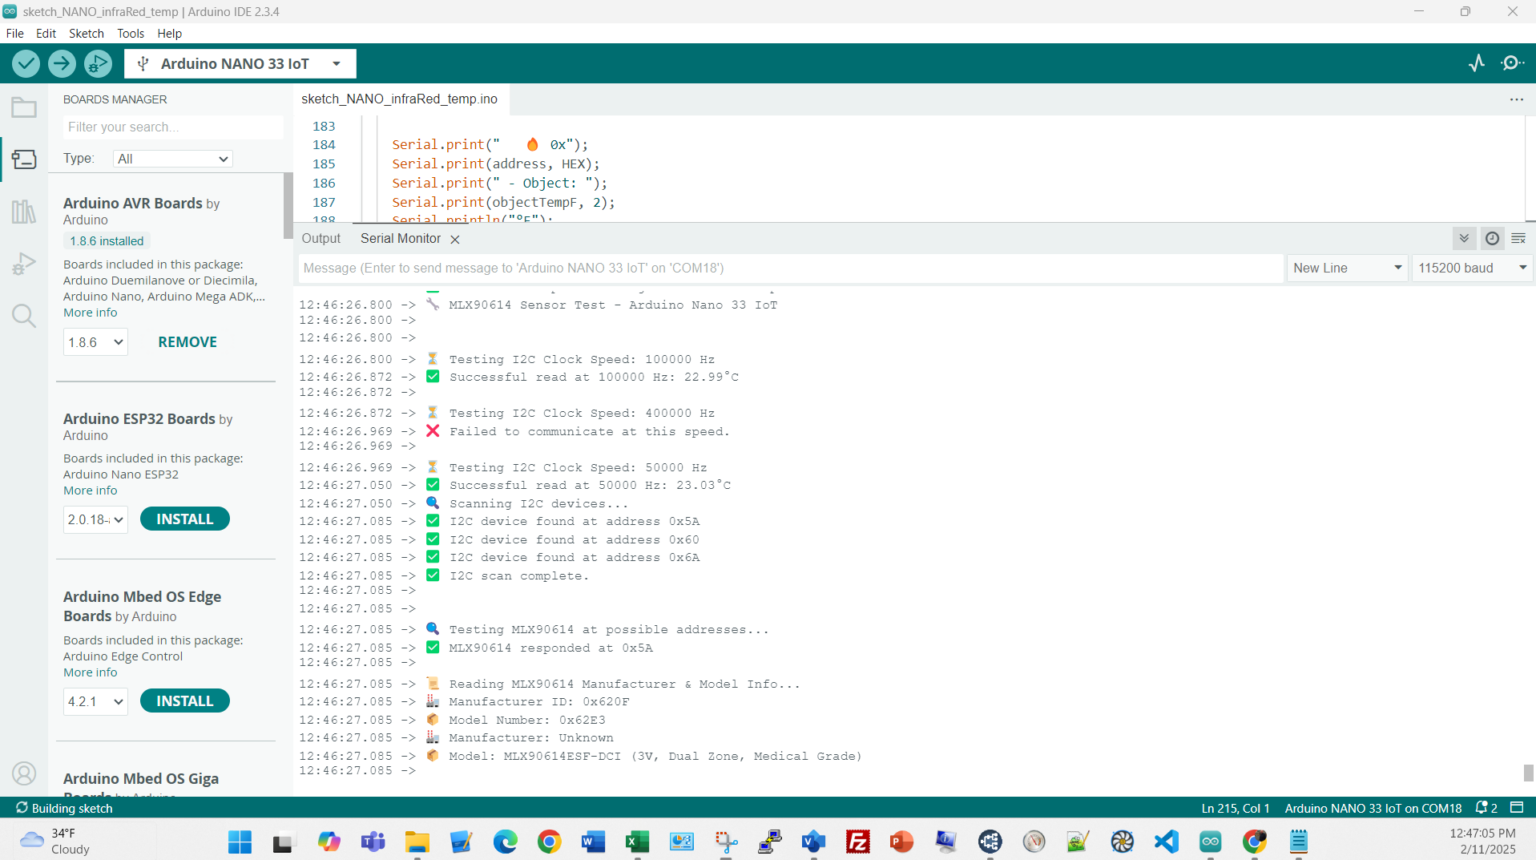
Once I had confirmed my sensors where ok to deploy, I placed them and the NANO IR test unit to the side and started to work on the NANO hardware and software.
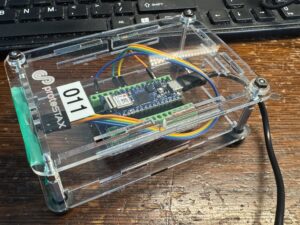
I then mounted the NANO unit in a ProtoStax case with the IR sensor as shown here to measure the object temperature (i.e. boiler stack).
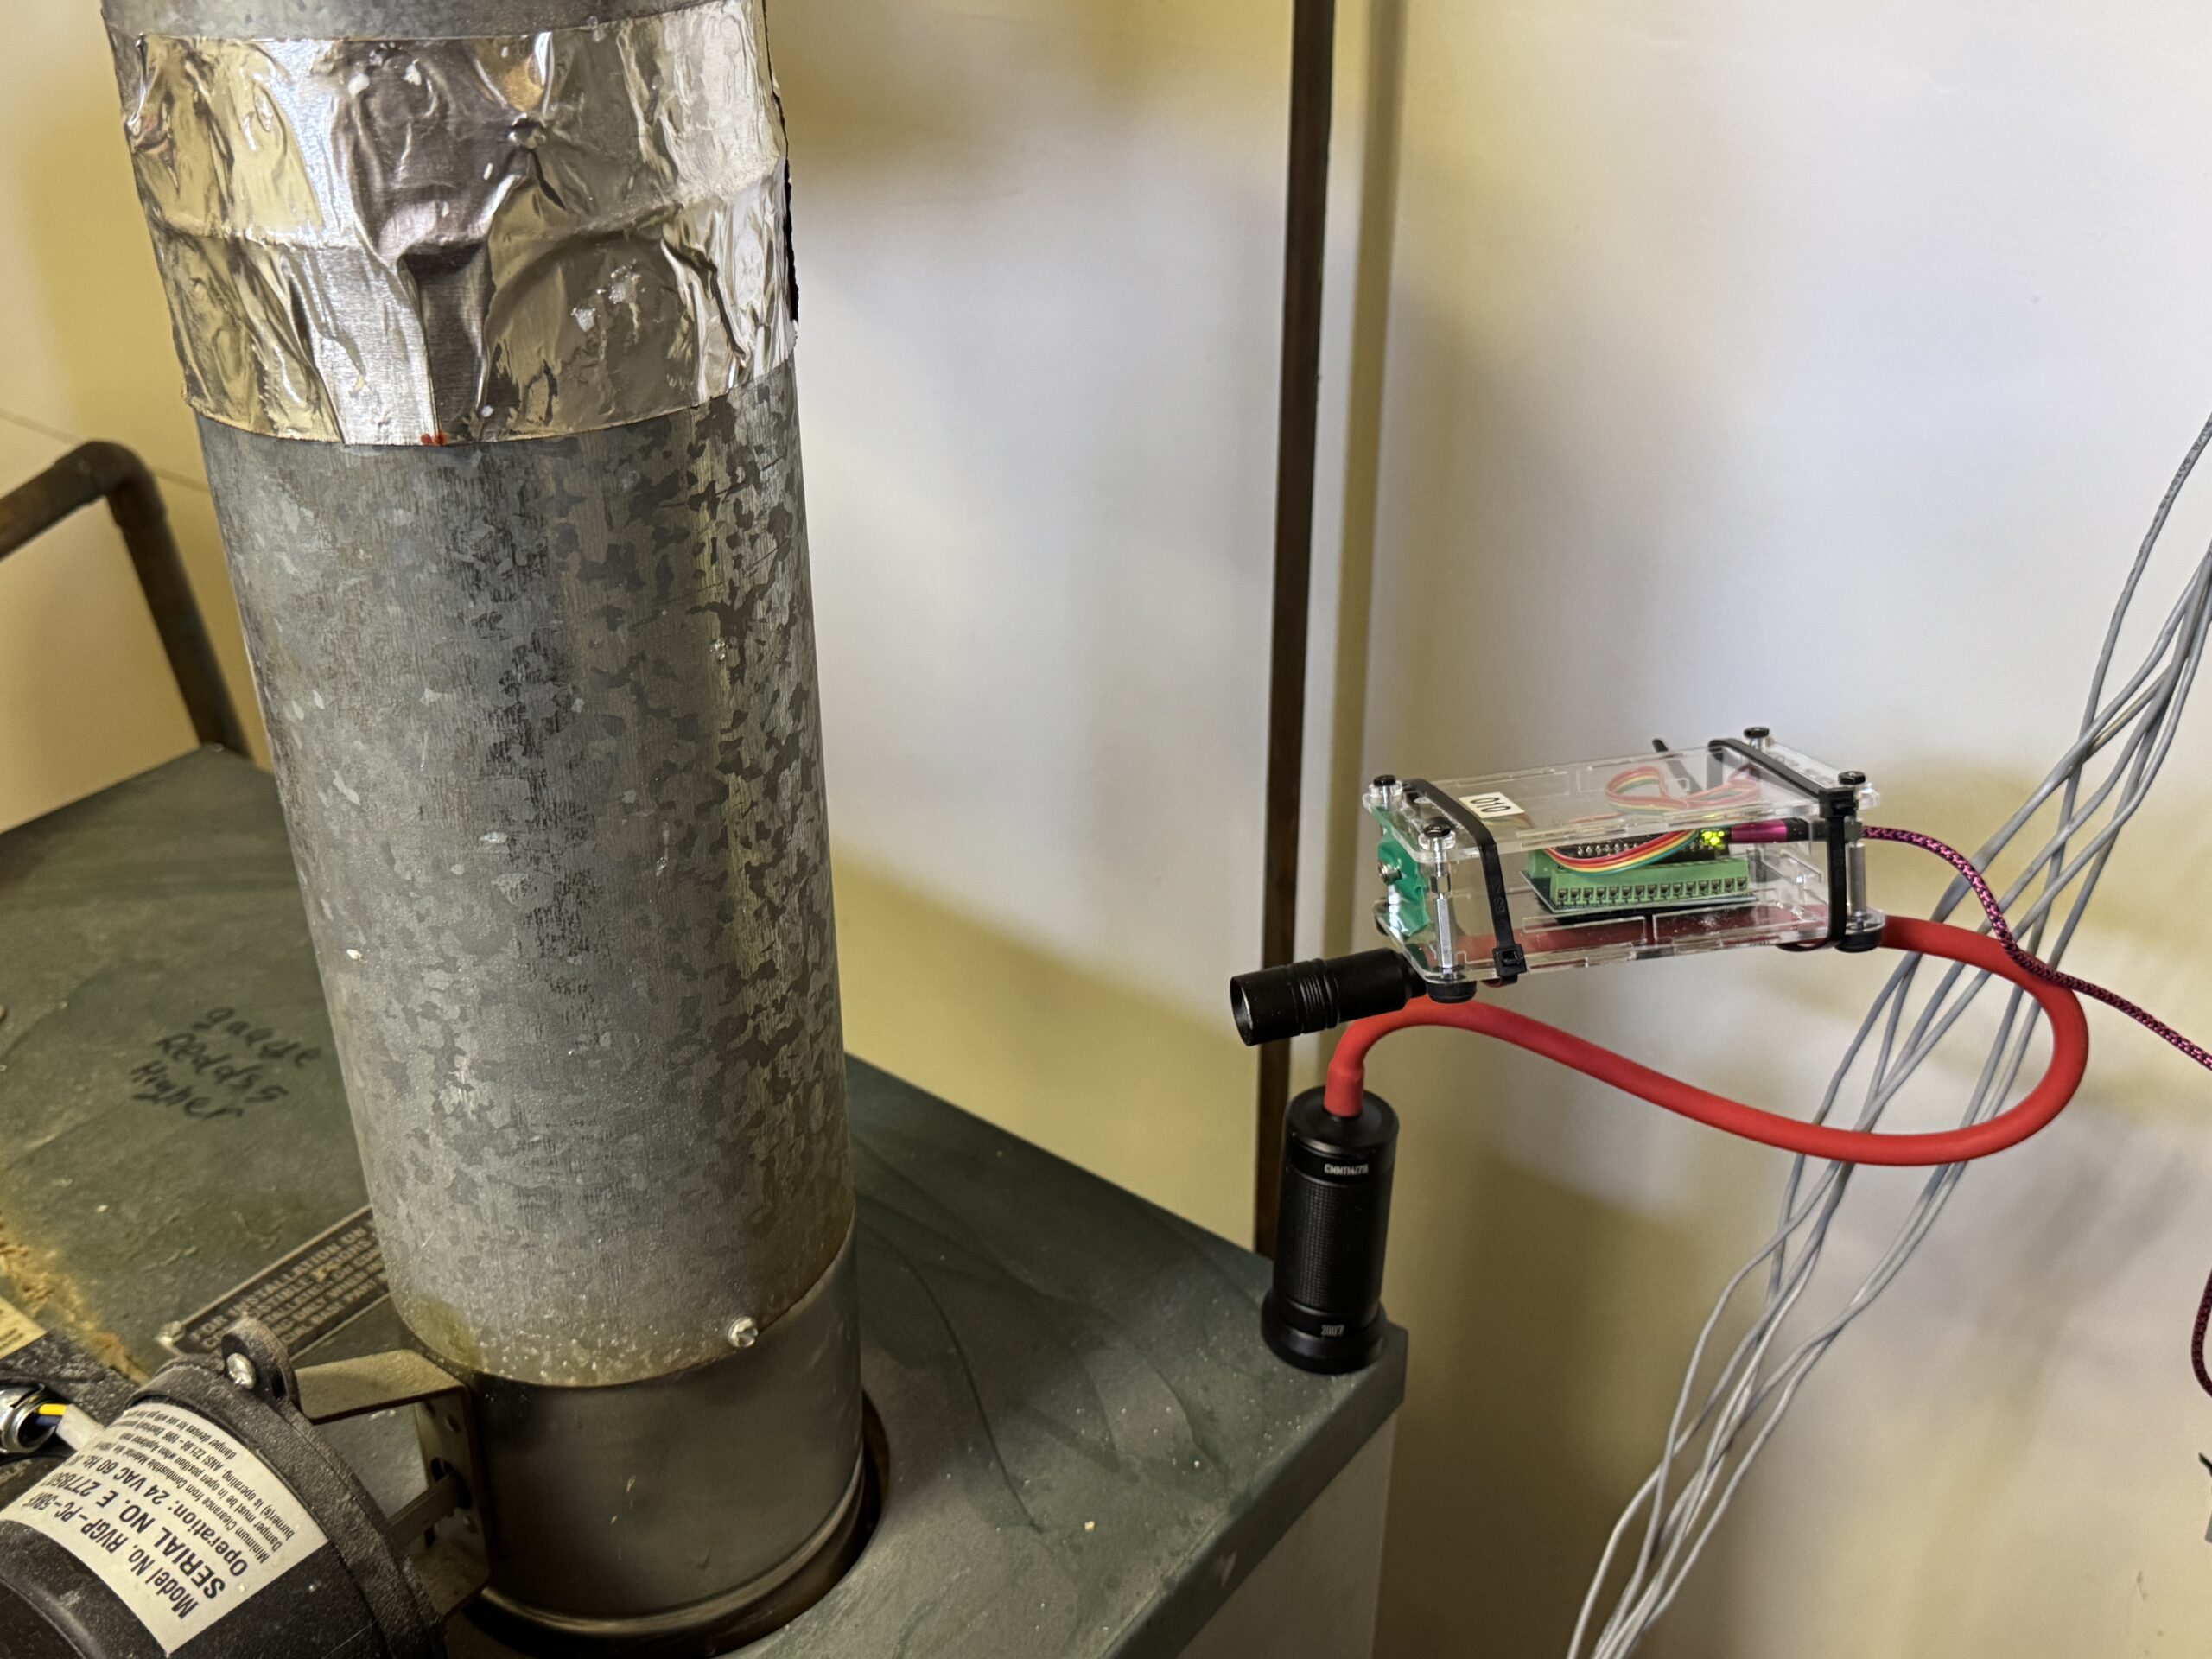
After the unit was programmed to just sense and publish the readings to the MQTT broker, it was ready to go, I attached it to a flexible magnetic base arm and aimed it at the boiler stack.
I now had MQTT readings continuously being published to the MQTT broker and available to a Node Red system running on the EnergyLab LAN. The Node Red program was used to sent the MQTT data to in InfluxDB database for long term storage.
With the time series data available in InfluxDB, I was finally able to see how well the sensor worked and would indicate the burner status with the IR sensor versus the CAD sensor. From the screenshot below you can see how much more responsive and sensitive the IR sensor (bottom plot) is compared to the CAD sensor (top plot) being used to indicate boiler state as ON (1) or Off (0).

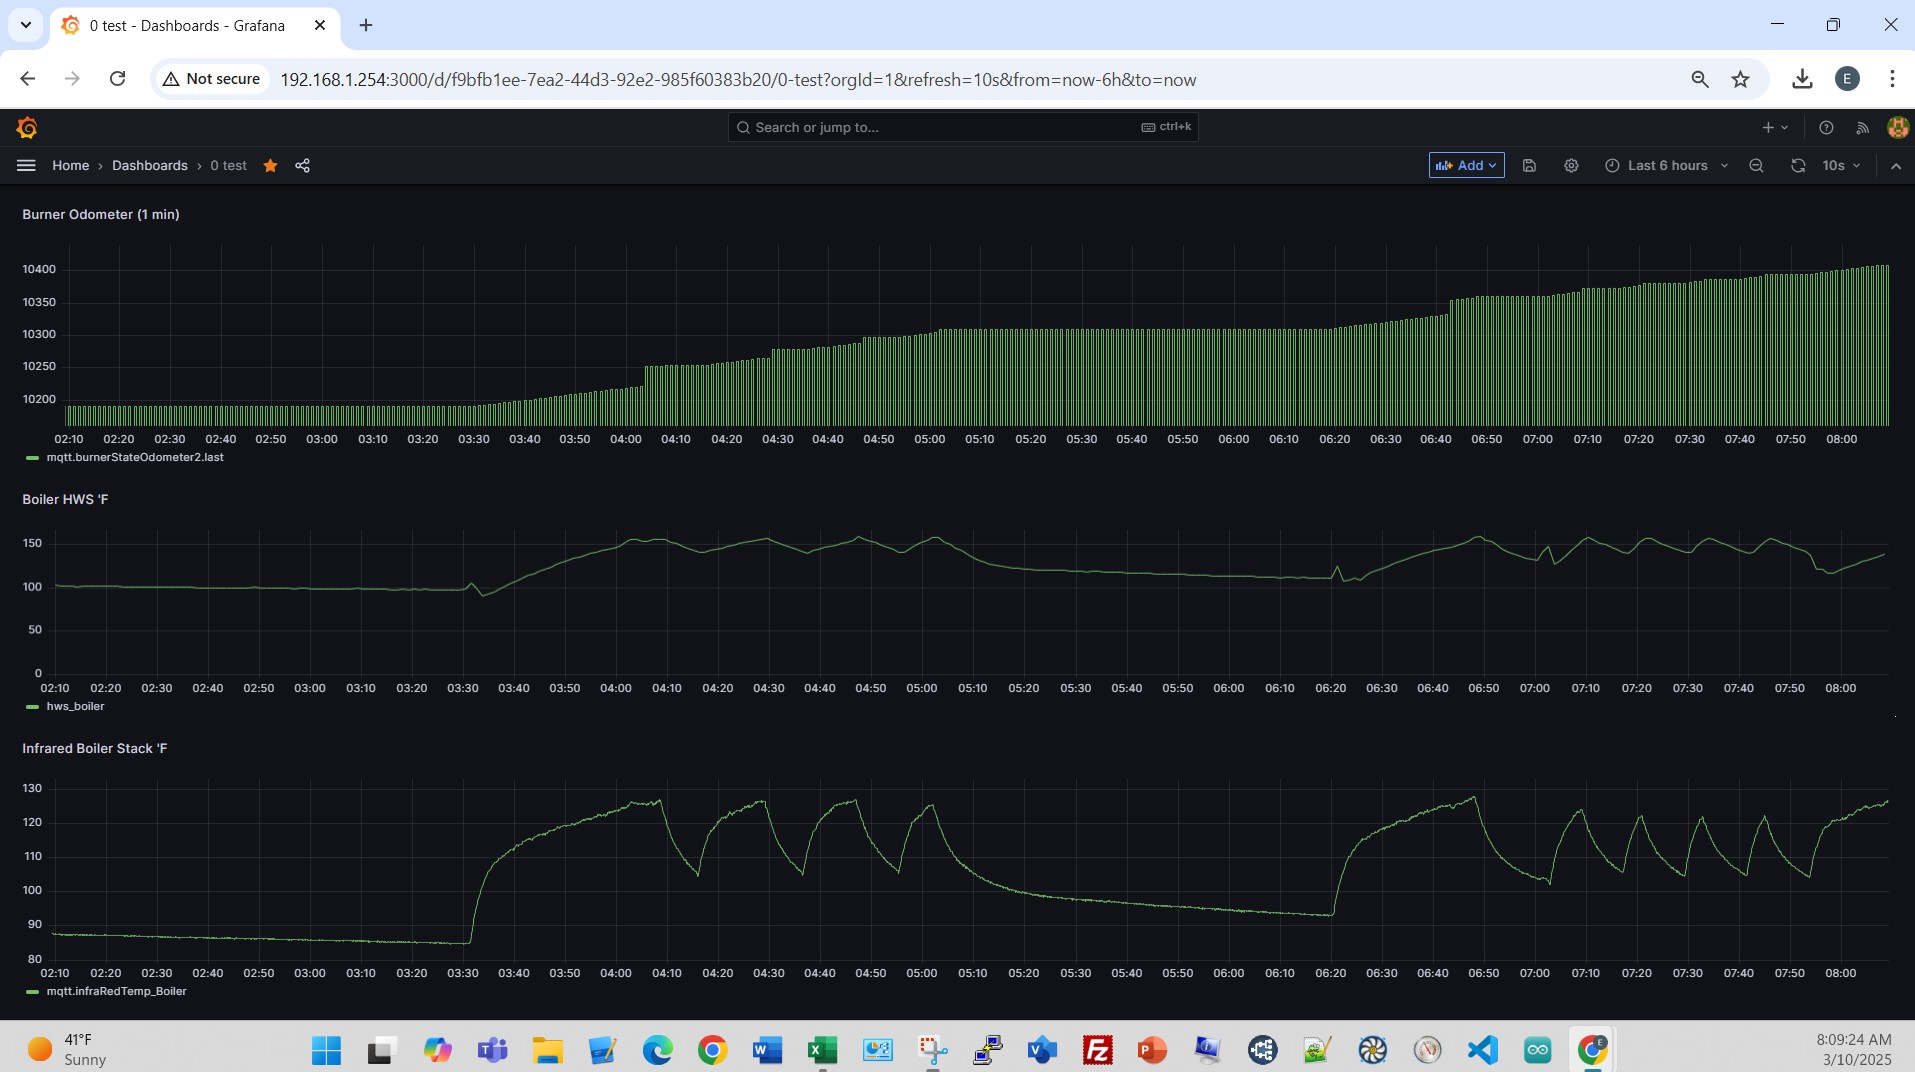
Here’s an example of the time series comparing the IR stack temperatures, Boiler HWS and a virtual burner odometer for a 6 hour period of time today, 03/10/25.
I’m still working and refining this workflow and output. It will be displayed on a local LAN webpage directly from a NANO, a OLED display connected to a NANO (see top of this blog posting), and a NANO running as a calculation engine and publishing directly to a Googlesheet.