Skip to content
EnergyLab TimeSeries

EnergyLab TimeSeries

Real-Time Data, Sensor Dashboards, and AI-Built Monitoring Systems

  • Welcome to EnergyLab-TimeSeries.com
  • Sandbox 3
  • Sandbox 5
  • Sandbox 6
  • Sandbox 8
  • Sandbox 9
  • Sandbox 10
  • Sandbox 11
  • Sandbox 12
  • Sandbox 13
  • Sandbox 14
  • Sandbox 15
  • EnergyLab Projects
    • EnergyLAB Journal
    • EnergyLab Data and Archives
    • EnergyLab Data Points – LAN
    • EcoFlow Power Station with Solar PV
    • Gas Boiler Efficiency Monitoring
    • Tracking Infrared Stack Temperature for Energy Use
    • IR Temperature Sensing Thermal Pane Window
    • Sandbox 1
      • Sandbox 1: Programming with Jarvis – NANO to Googlesheet in WordPress
    • Sandbox 2
      • From Sensor to Sandbox: Inside EnergyLab’s Real-Time Data Flow
  • EnergyLab Programming
    • From Keyboard to Control Center: Building a New Kind of Lab with ChatGPT
    • Engineering with ChatGPT
    • Programming with ChatGPT – Lessons Learned and Best Practices
    • Team EnergyLab: How I’m Building the Future with ChatGPT
    • EnergyLab Archives
  • About Us
  • Toggle search form

Sandbox 12

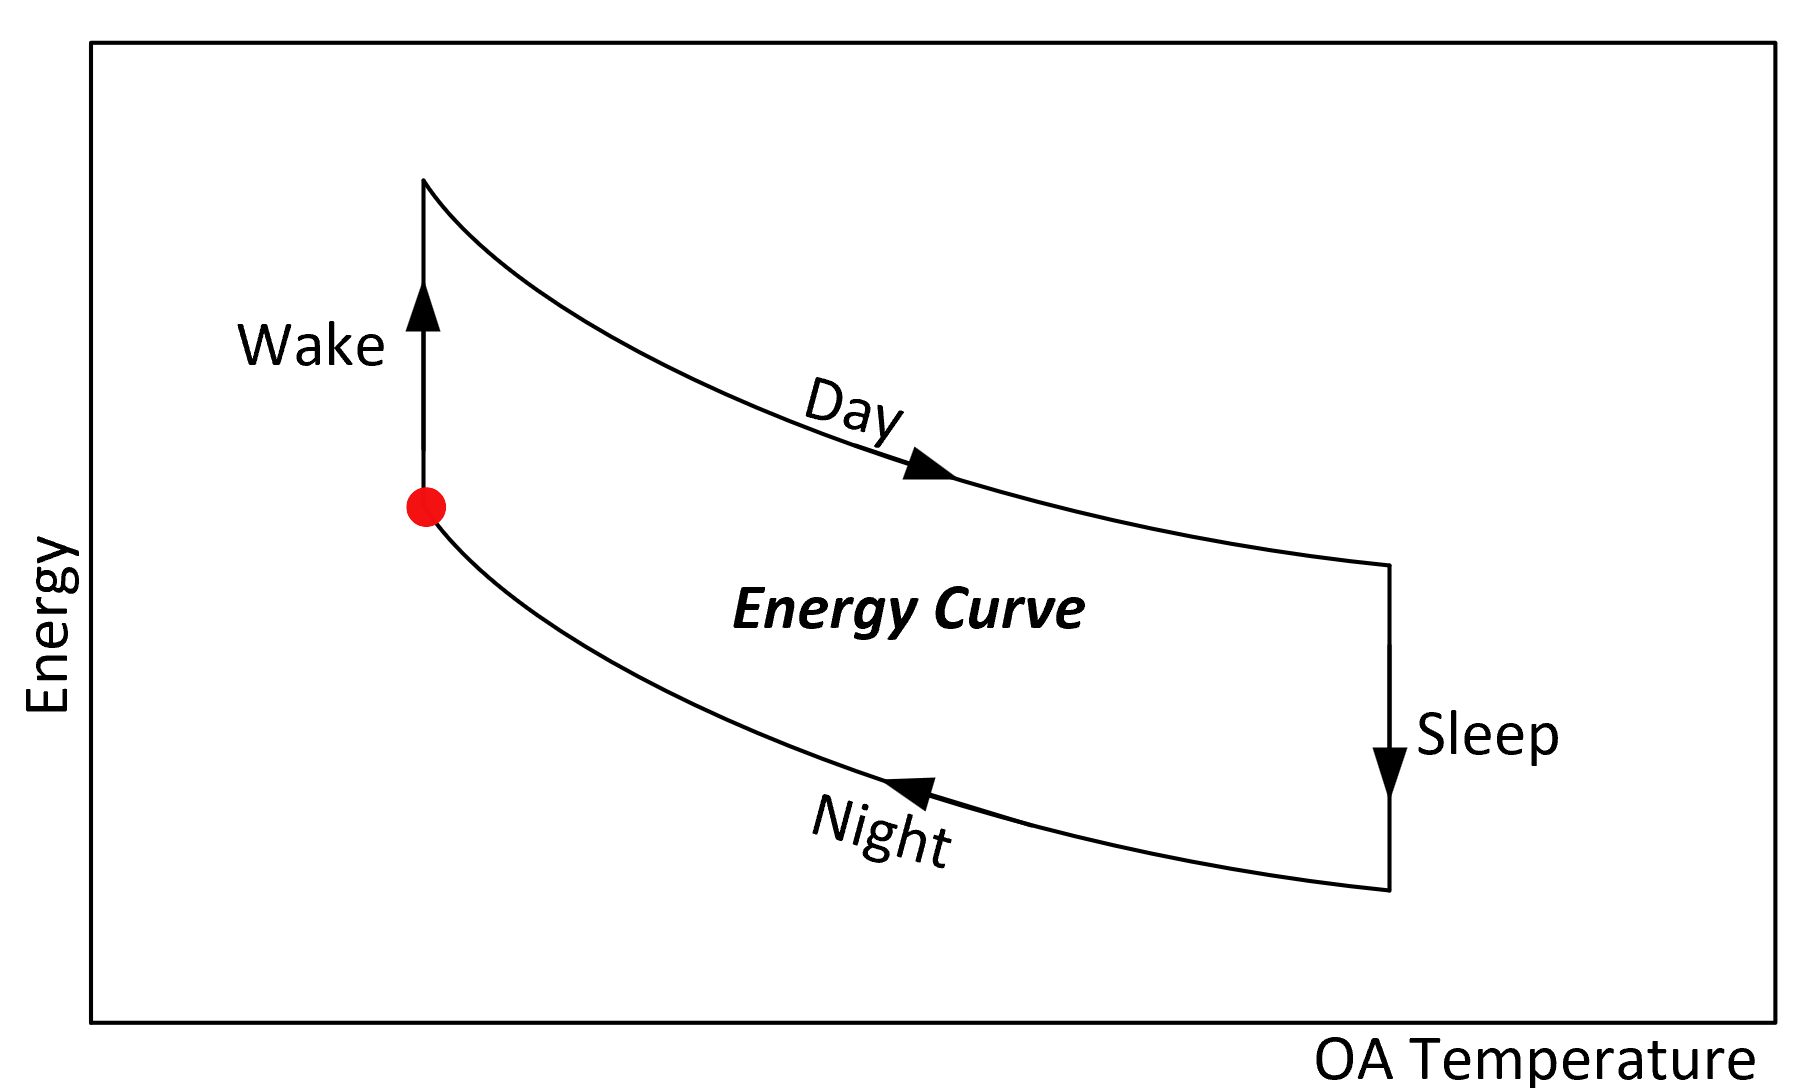
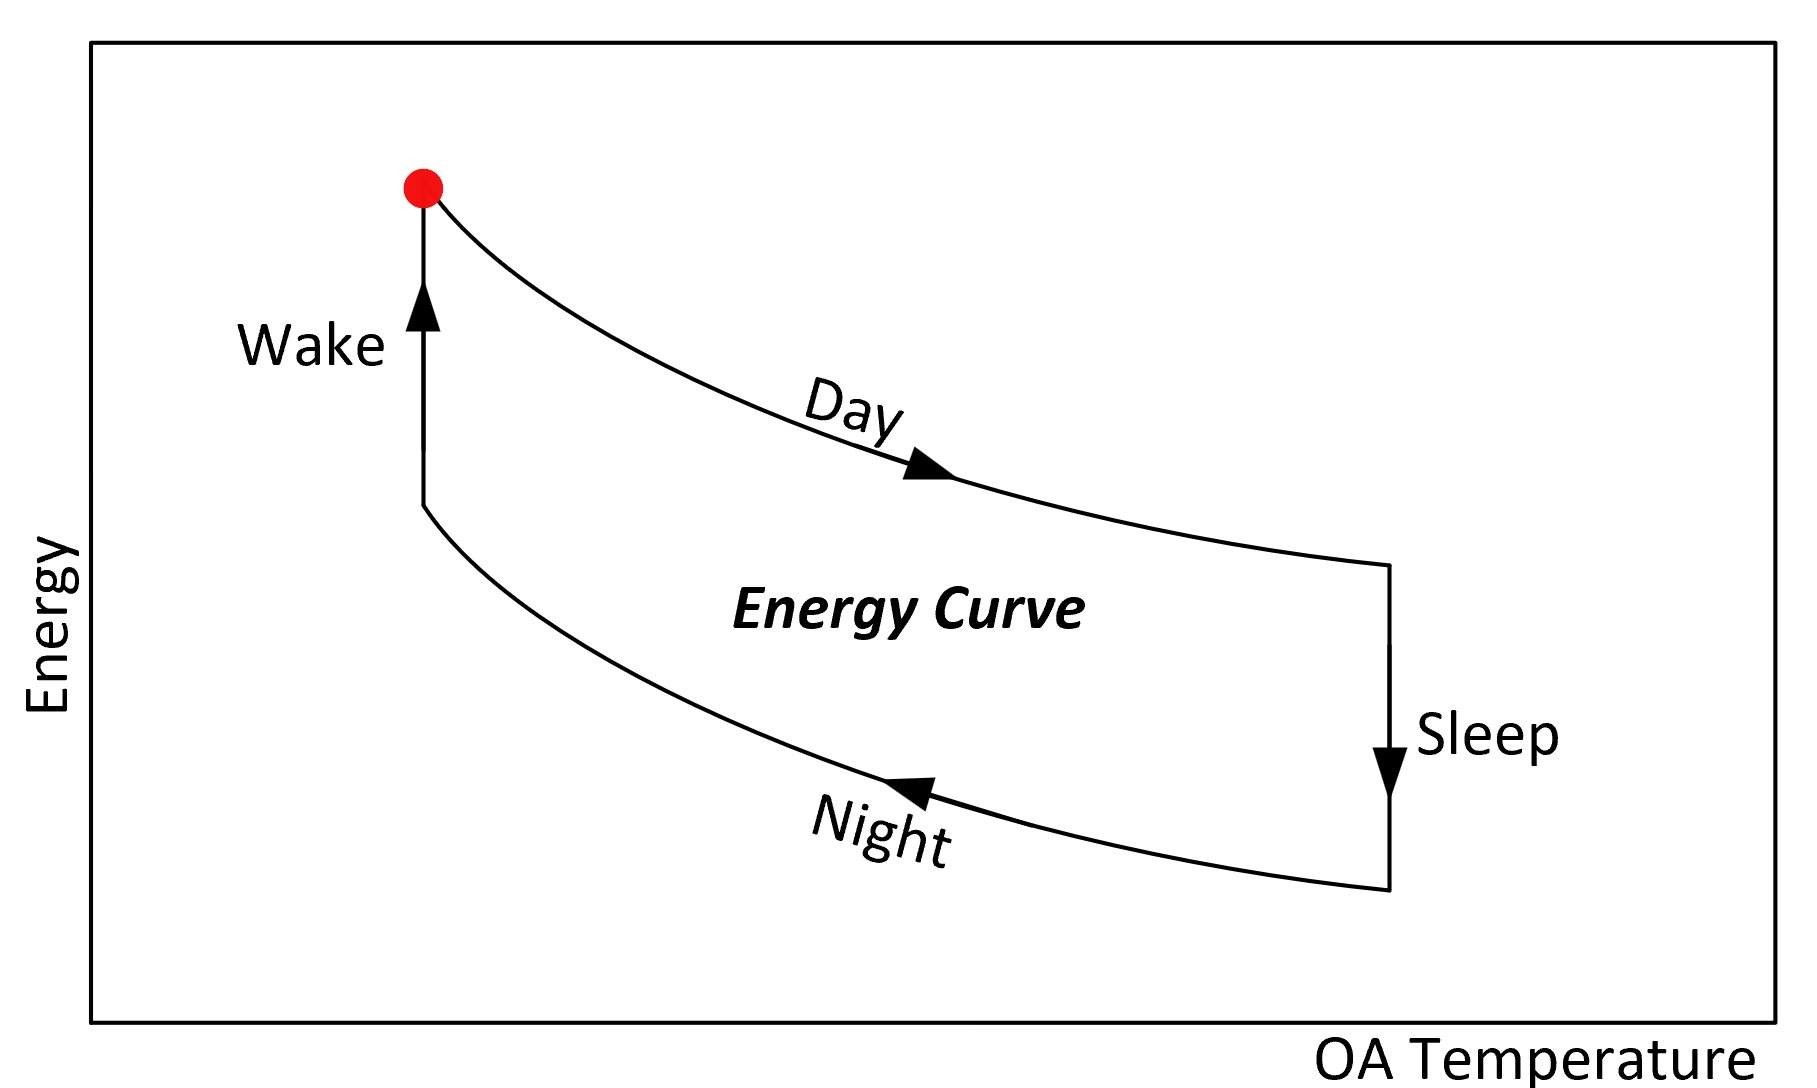
Example of heating season “Energy Cycle” and how it moves through its four distinct phases.

Loading...
Loading...

The Energy Cycle is a foundational insight first discovered and documented by Edward Brzezowski, PE, in the mid-1980s. This document details that original discovery and highlights its profound influence, continuing today across various EnergyLab Sandboxes and real-world applications.

See a copy of the article in PDF format here [LINK]

Share this page:

Copyright © 2025 Cross Creek Solutions LLC.

Powered by PressBook WordPress theme