While developing the IR sensor to monitor the boiler, I made a few extra units to experiment with.
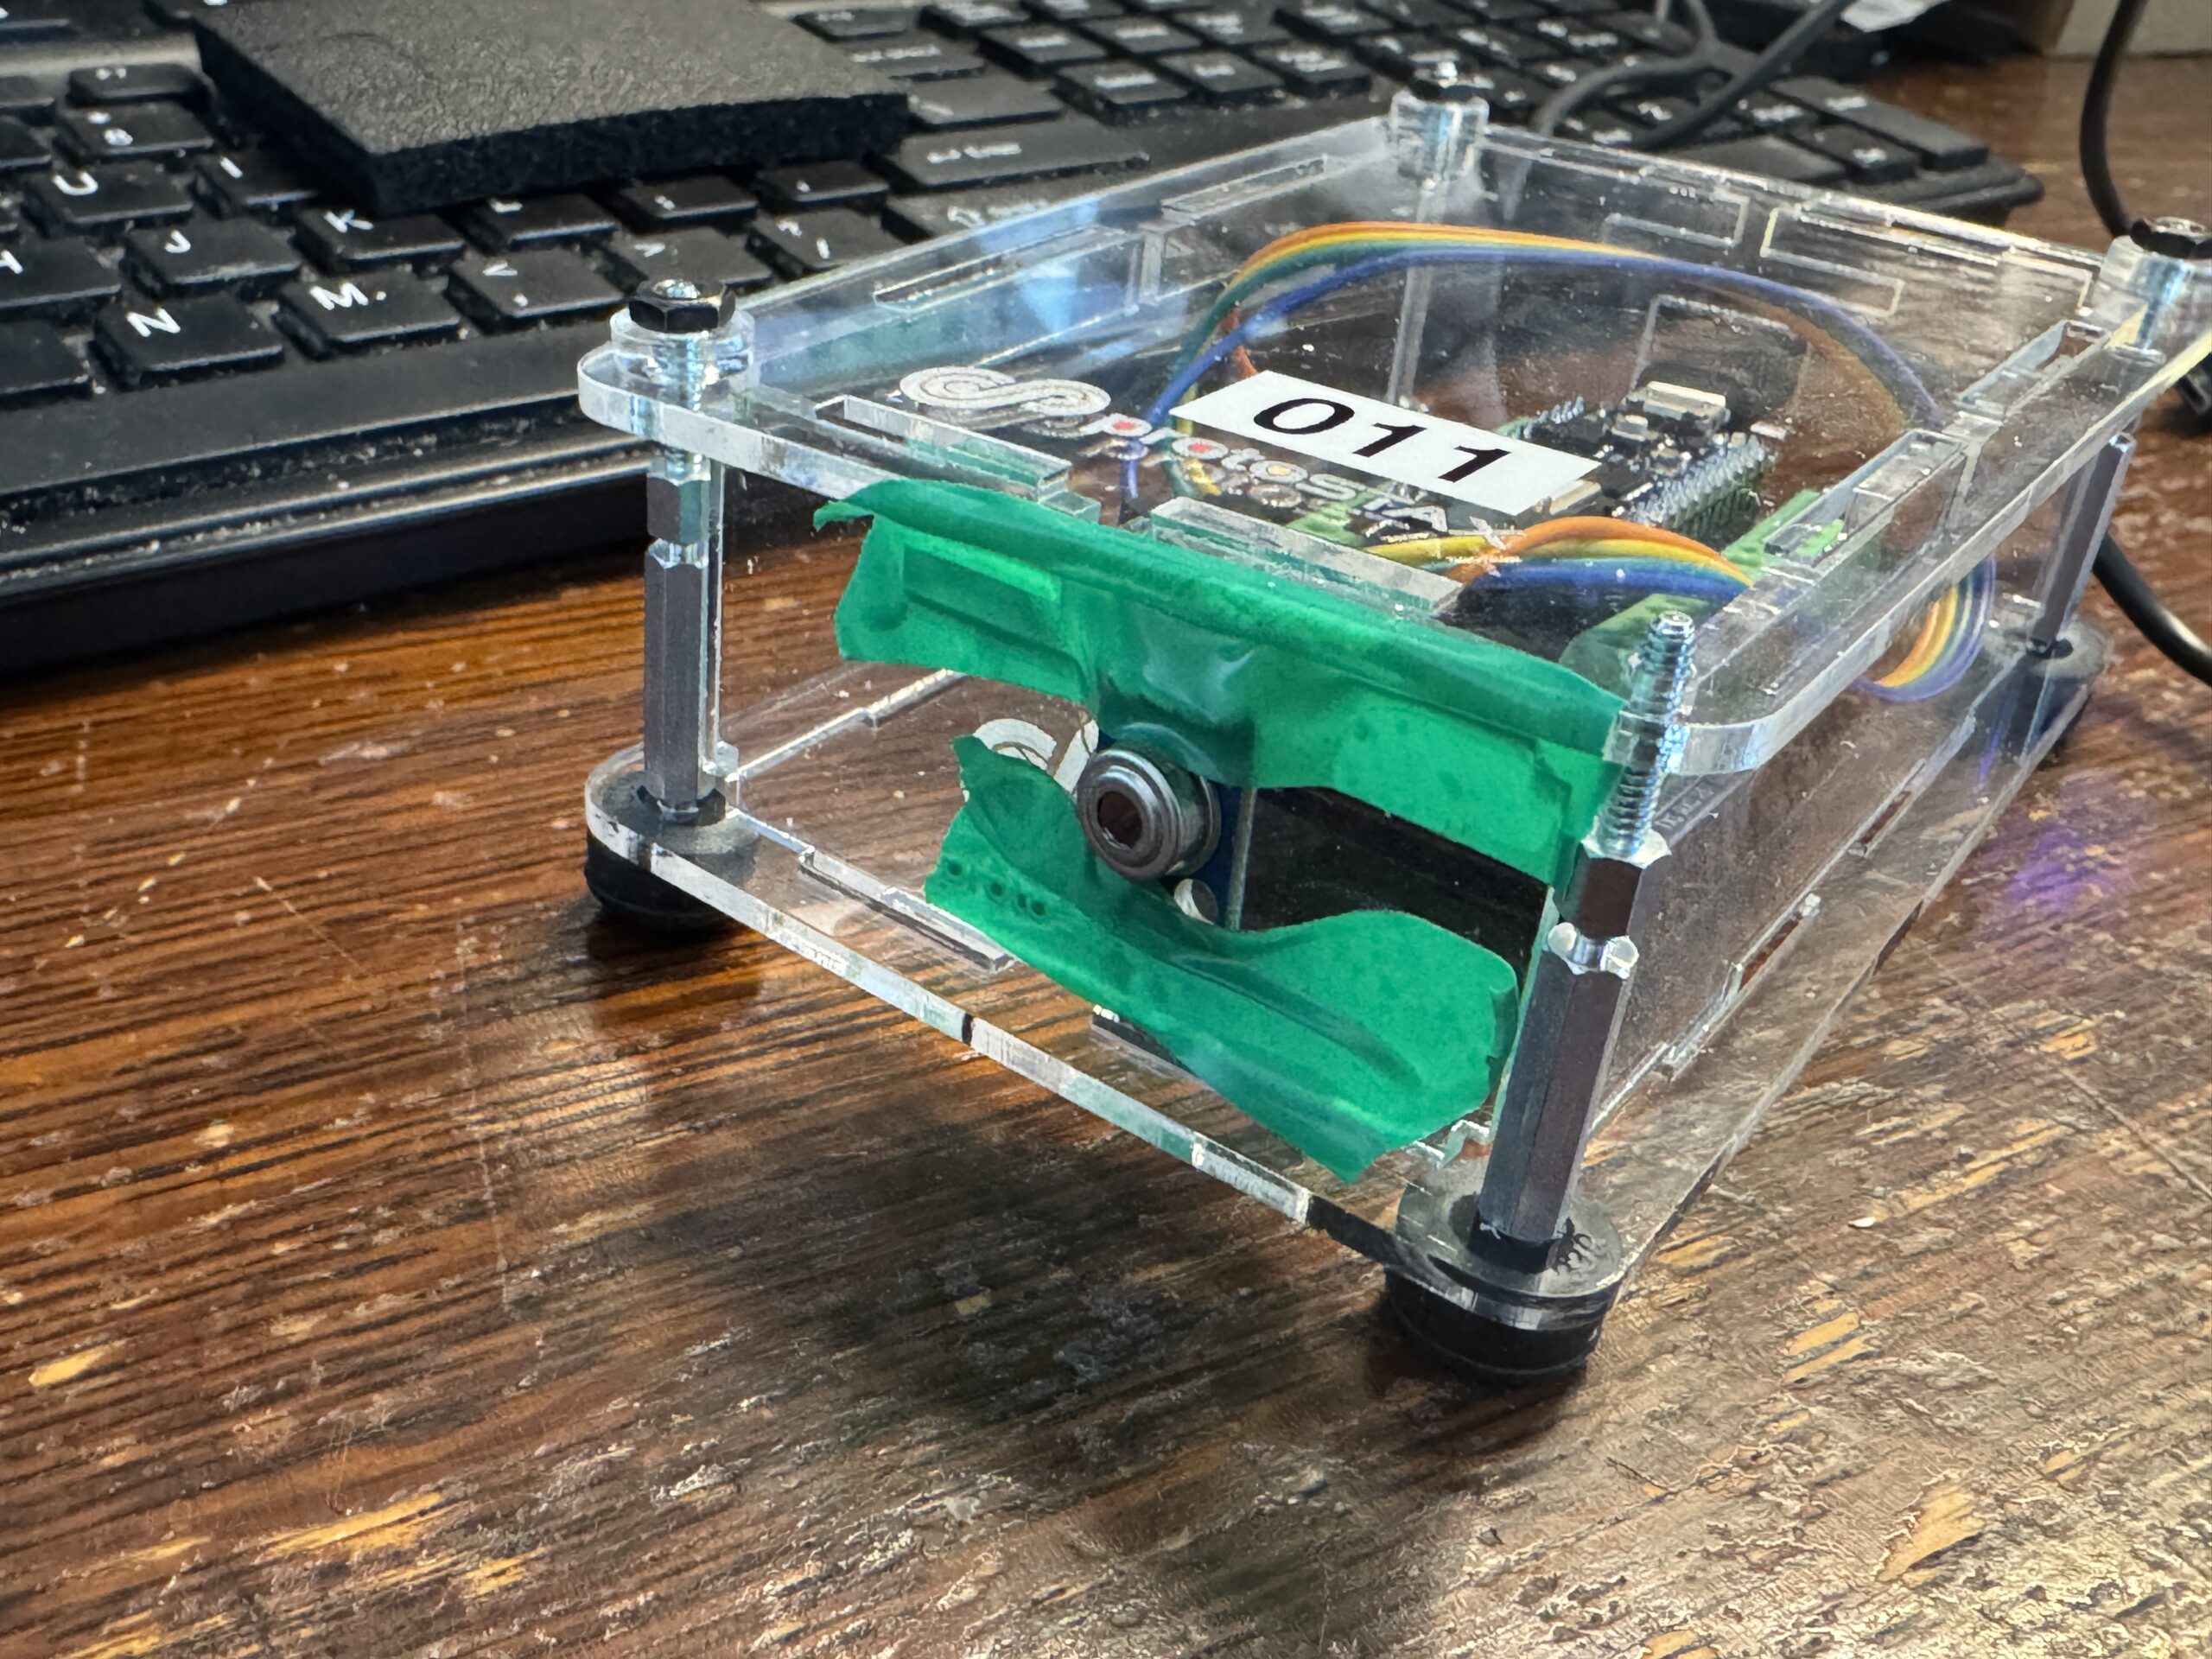
I’ve set one up pointing at the inside of a thermal pane window facing east starting on 02/11/25.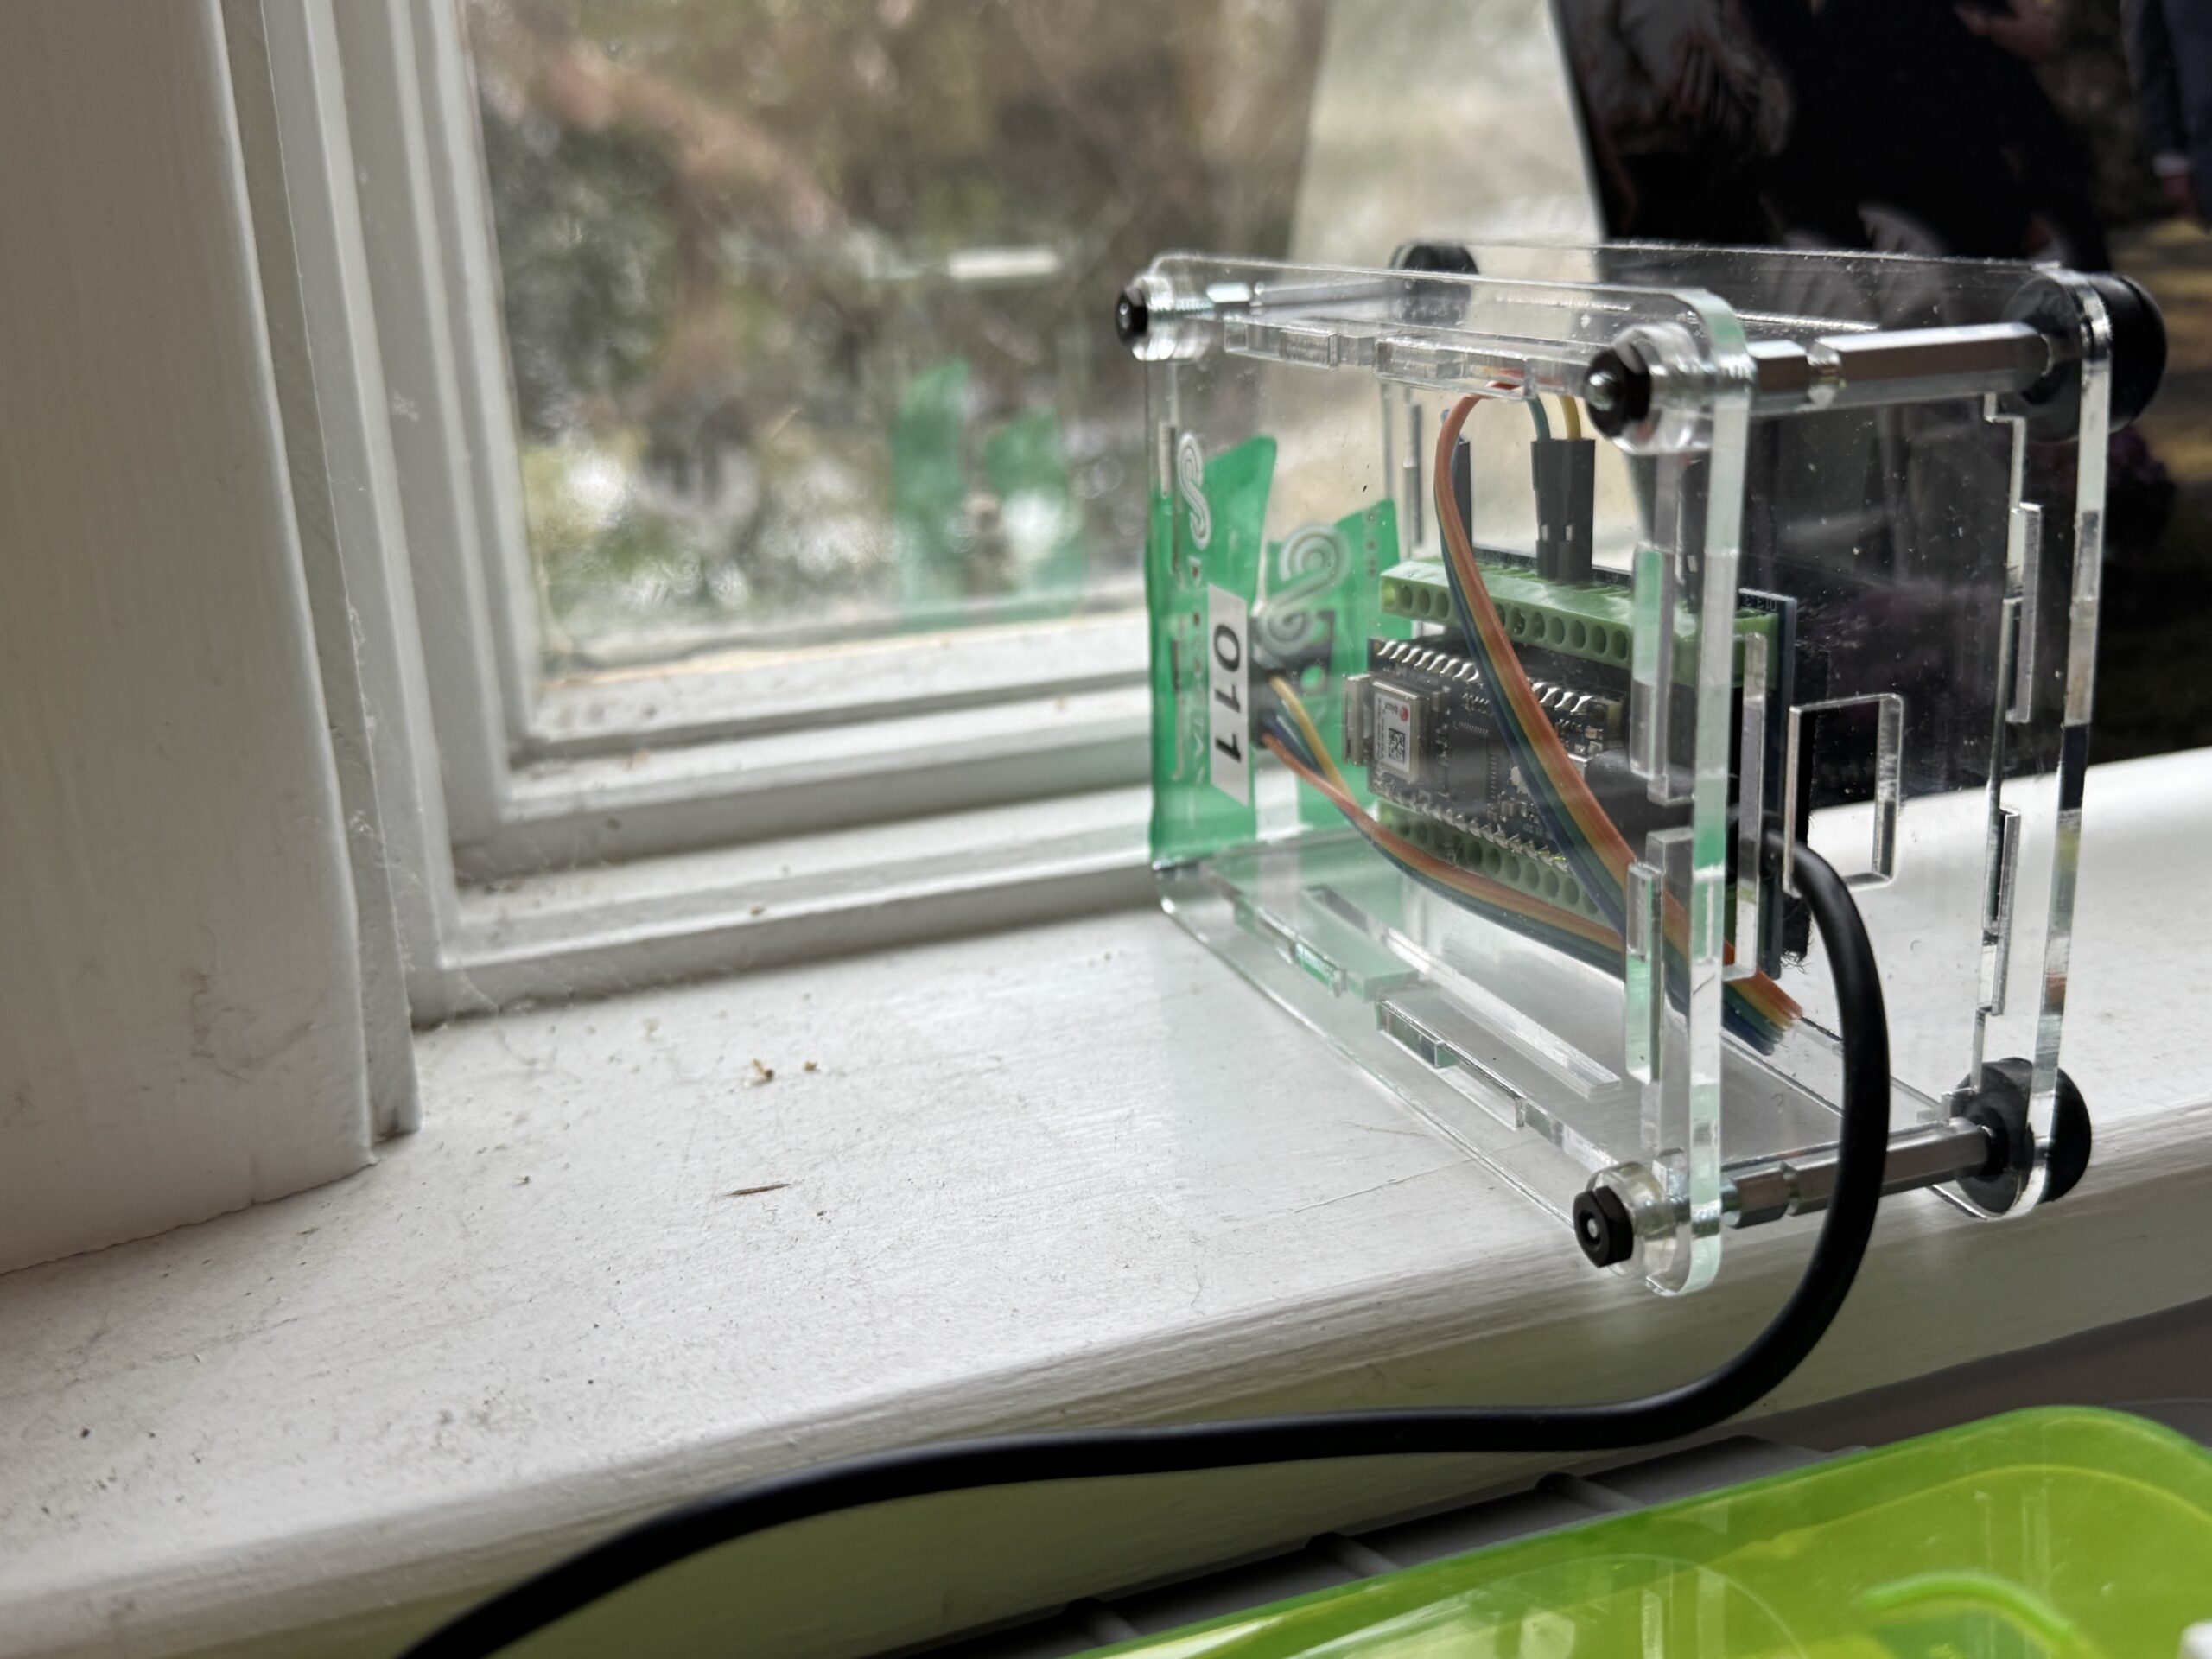
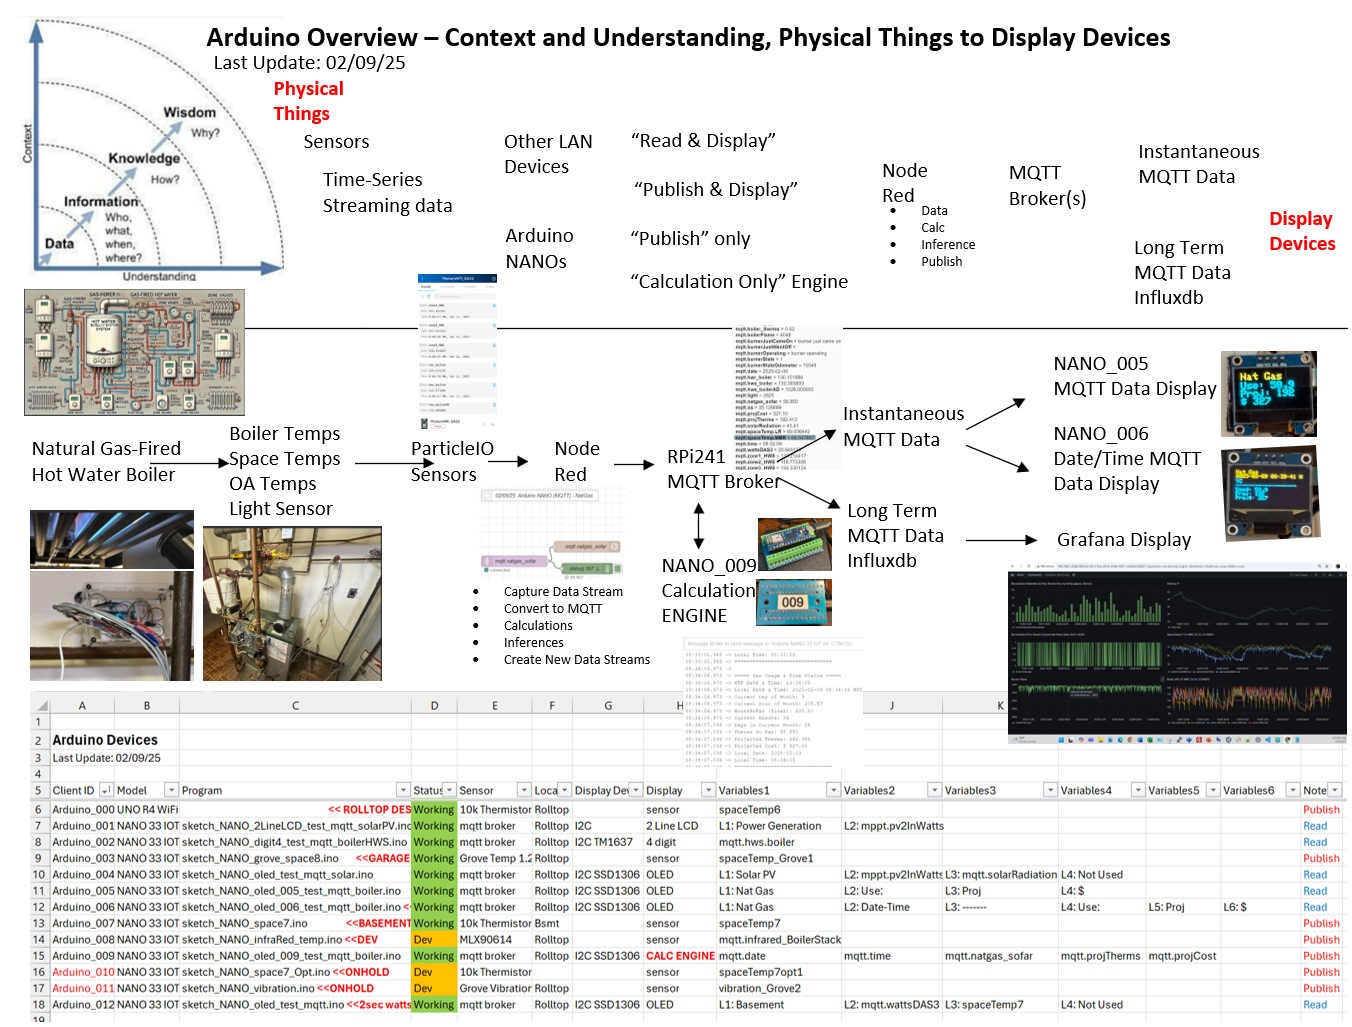
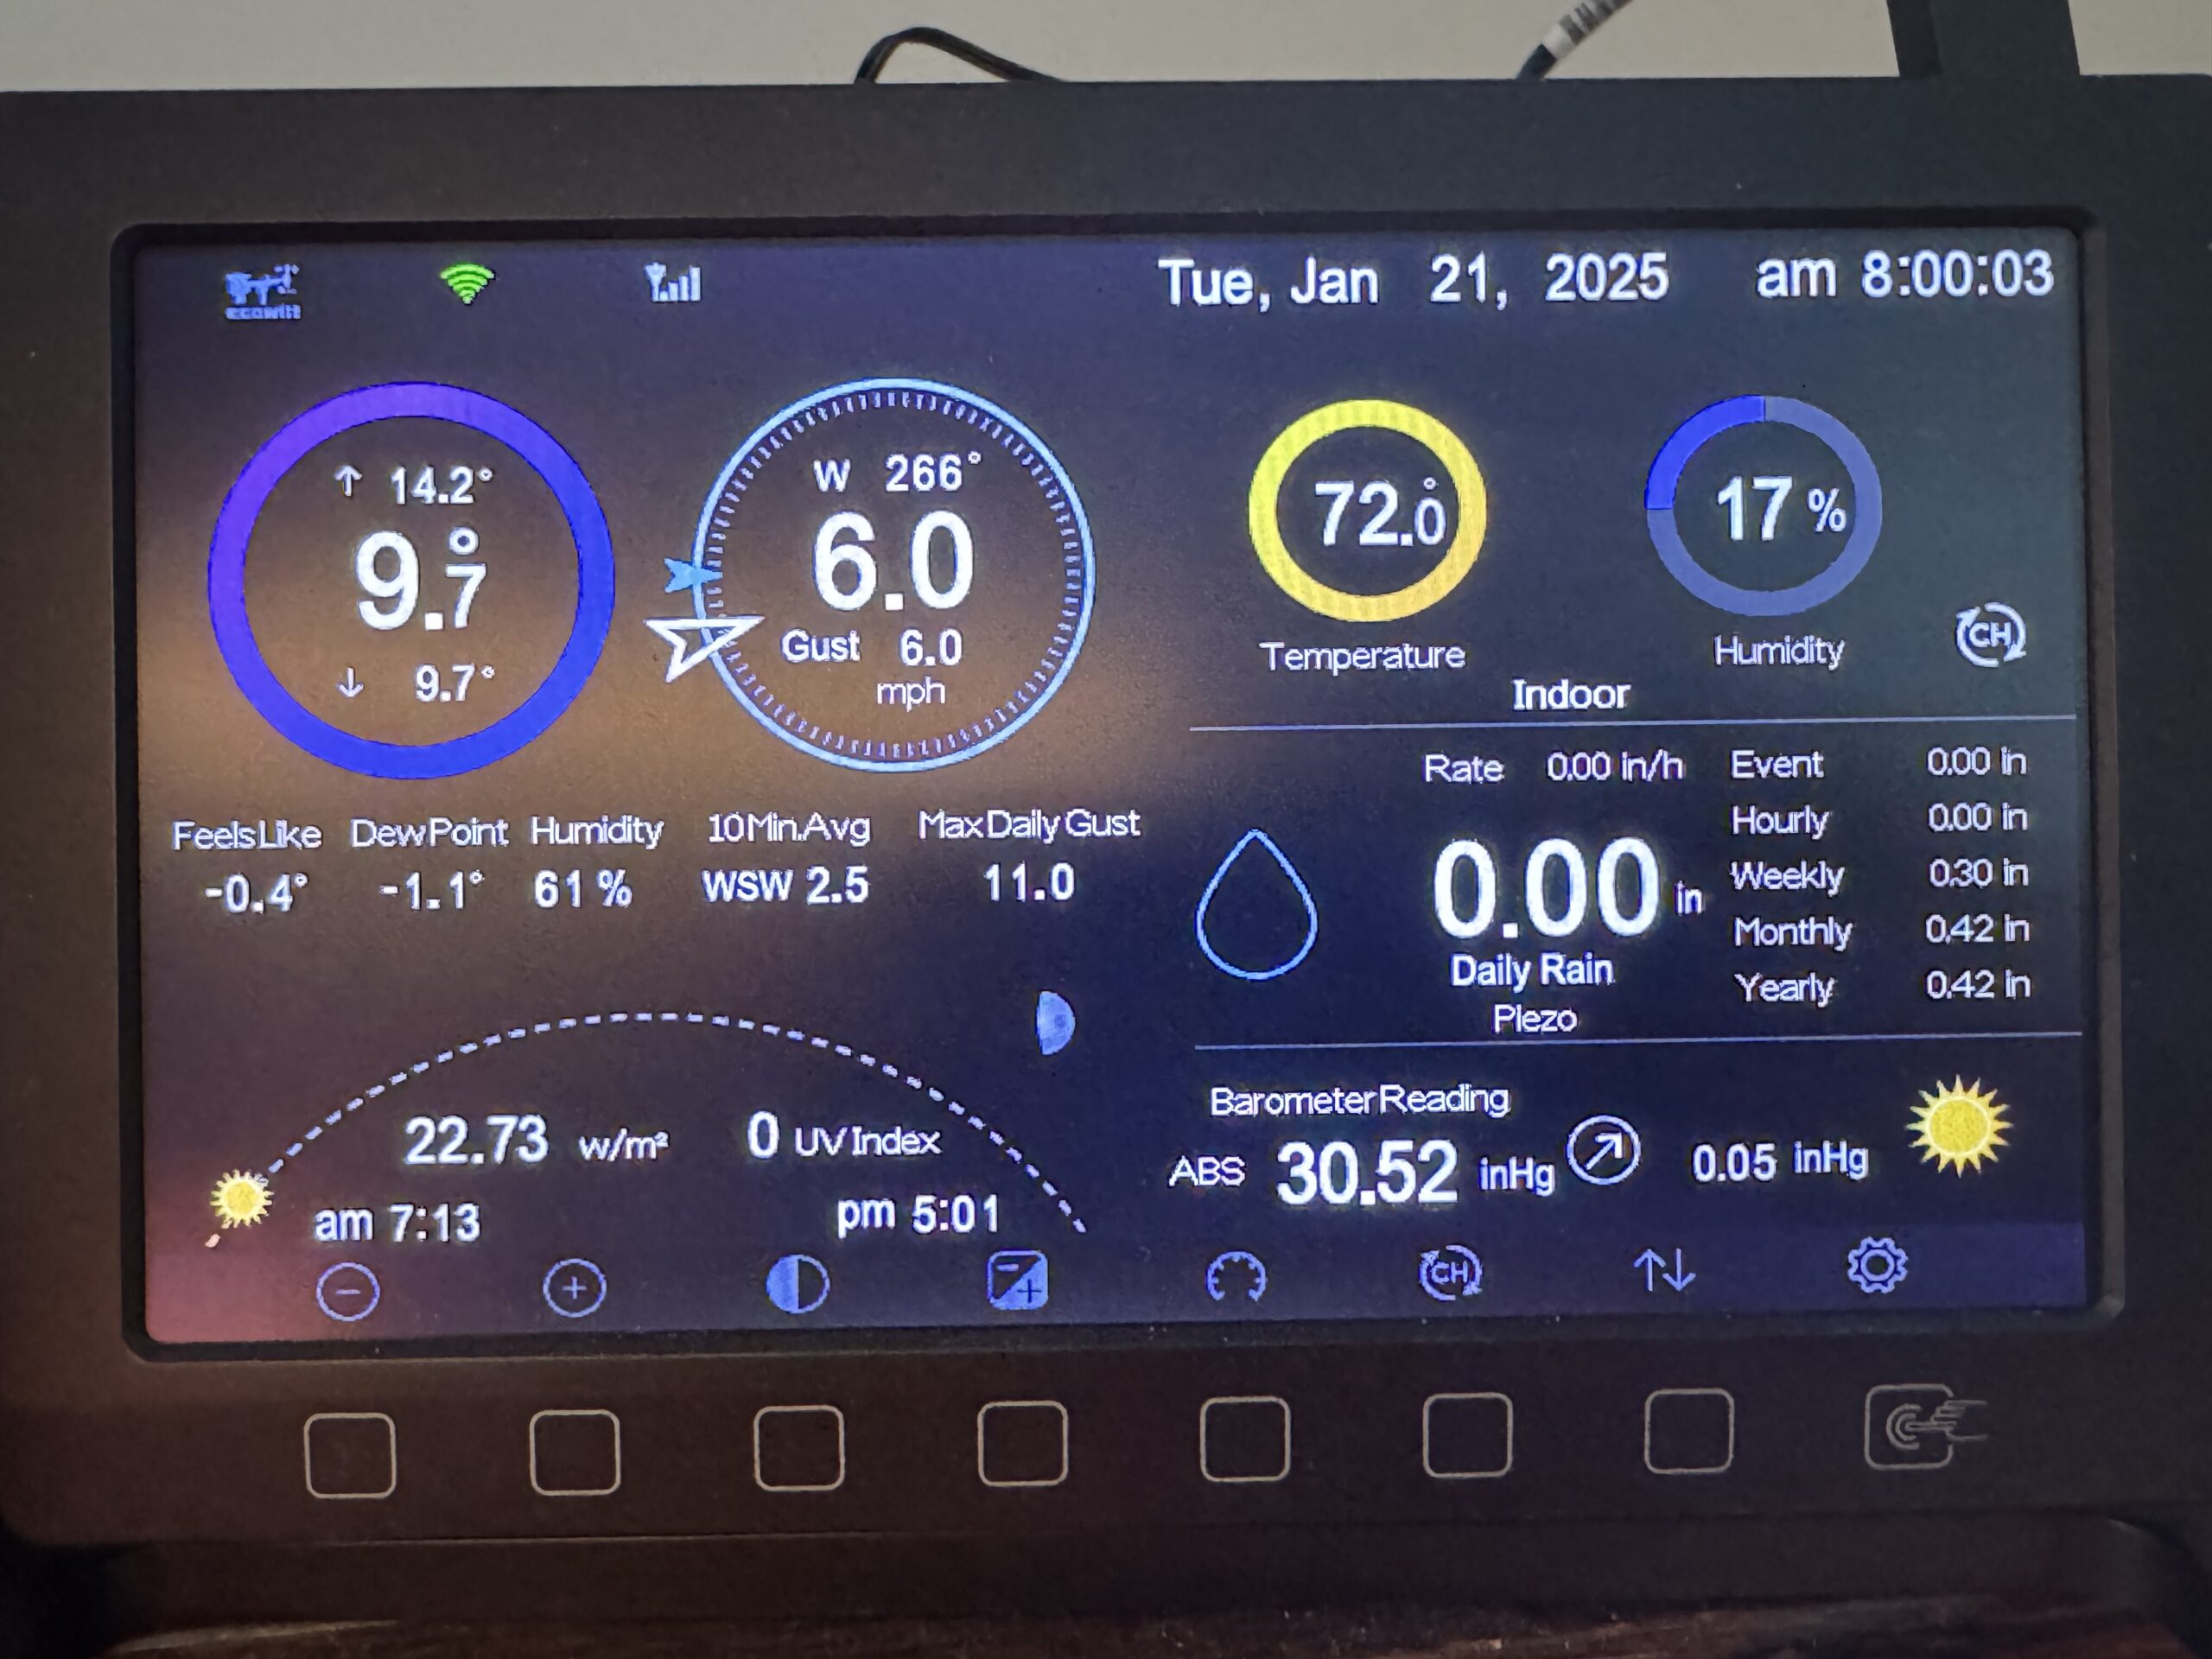
As with the other NANO devices on the EnergyLAB LAN, the NANO sensor data is sent to Node Red and the MQTT Broker. To have this in a data stream as time series data, its setup in Node Red to send the stream to the InfluxDB database. The Ecowitt weather station on the EnergyLAB LAN is also connected to Node Red and the weather data is published every minute to the InfluxDB database.
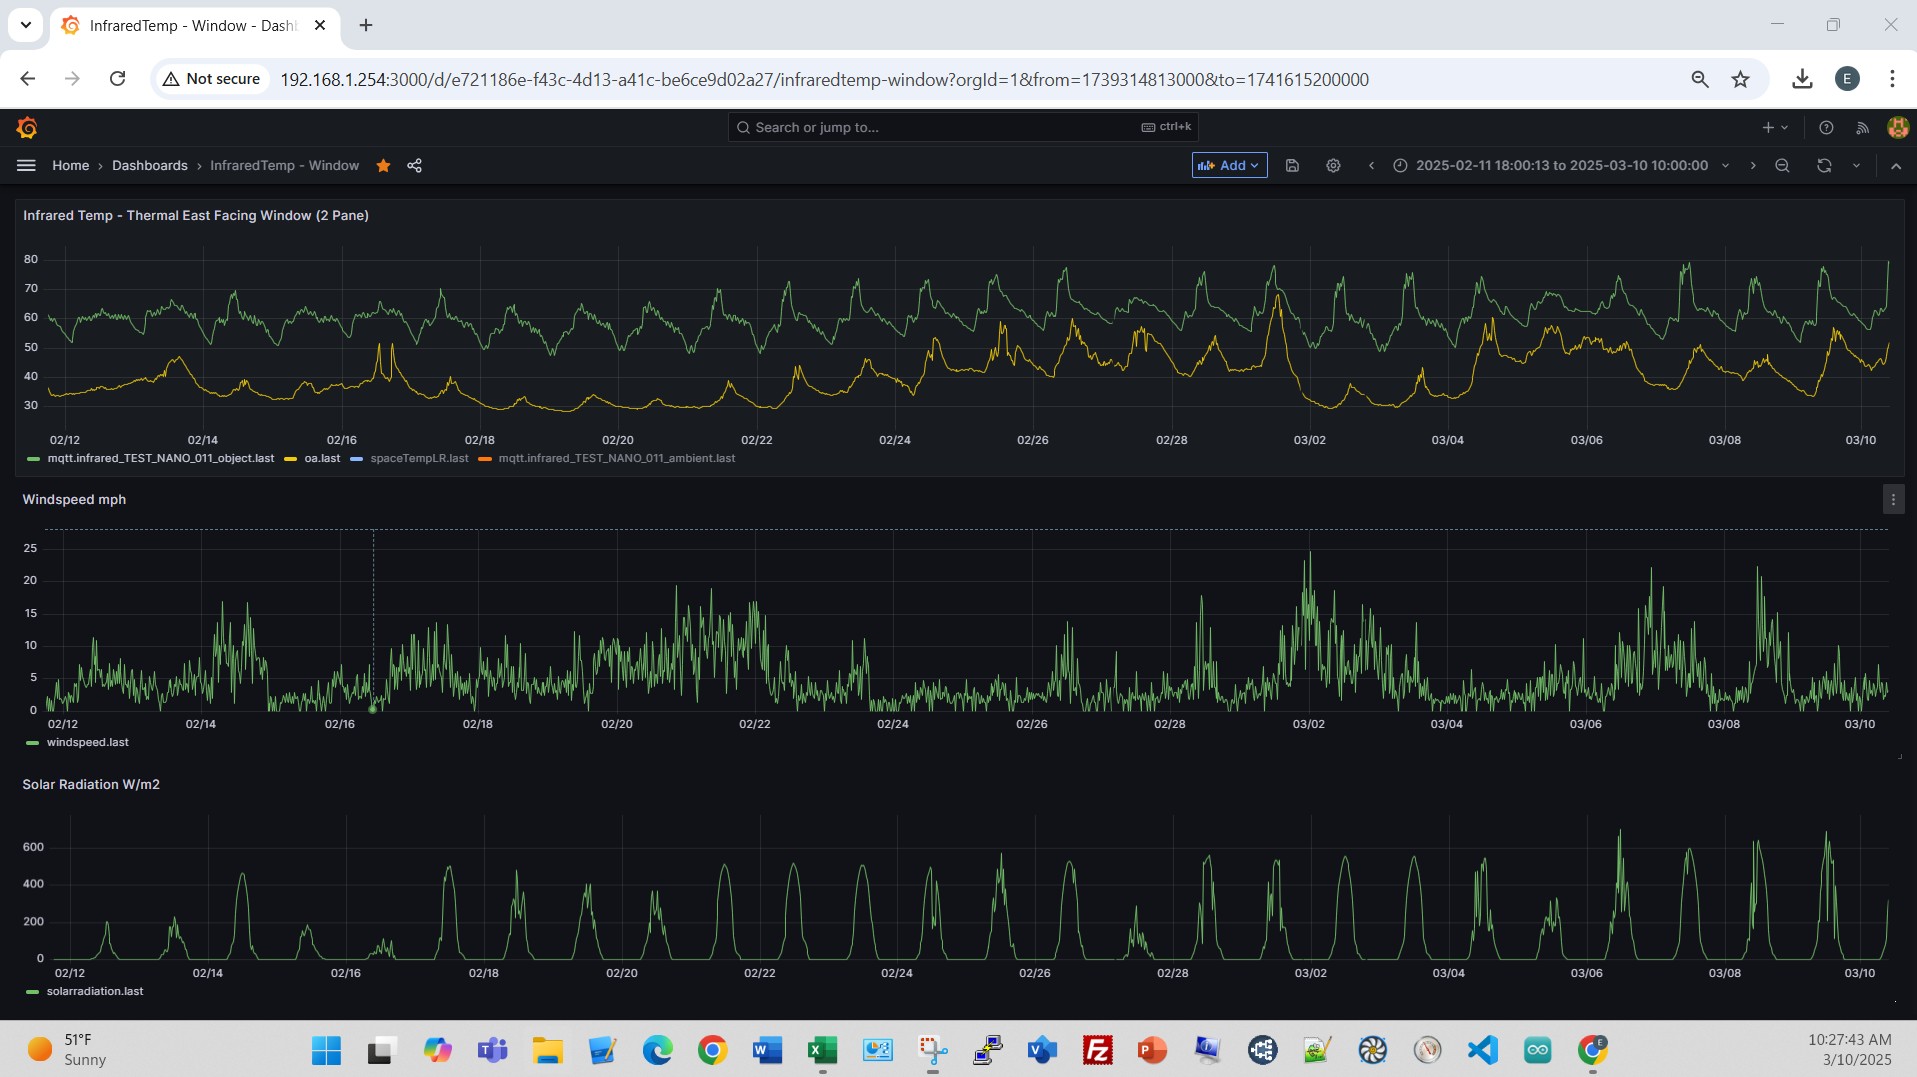
Here’s what some of this data looks like from Grafana pulling the InfluxDB database. Looking at the last 7 days. The OA temperature and windspeed and solar radiation are brought in from the weather station on the Grafana plot. The object (window) and ambient (room) temperatures are from the NANO unit, in this case NANO-011.
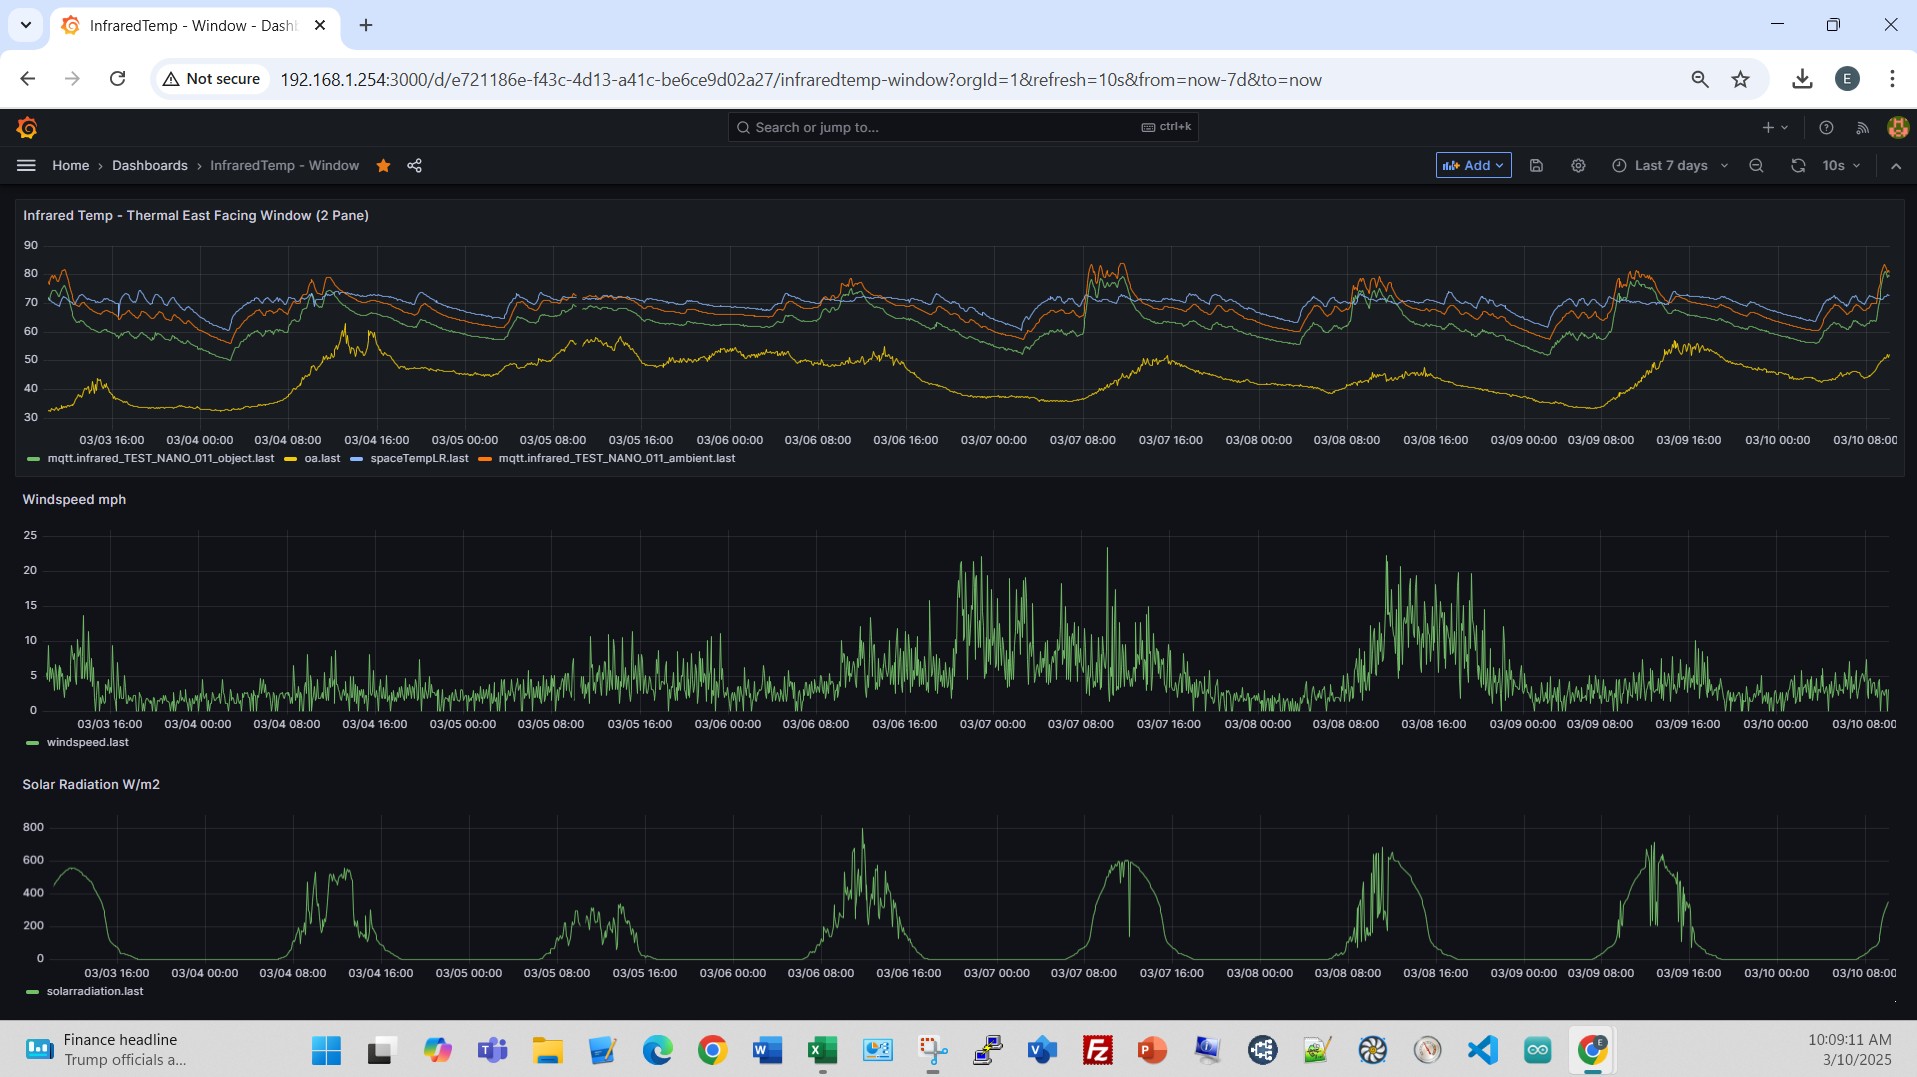
As expected, on sunny days the window temperature climbs with the sun’s intensity. Other less obvious observations include; 1) the window and room temperature profile follow the thermostat schedule, 2) the window temperature climbs above the outdoor temperature on sunny days, 3) the window temperature changes faster than room or outdoor temperatures, and 4) looking at various days at midnight, on a cold night, the difference between the wind and outdoor air is about 17-20’F, whereas on warmer nights its about 10-14’F.
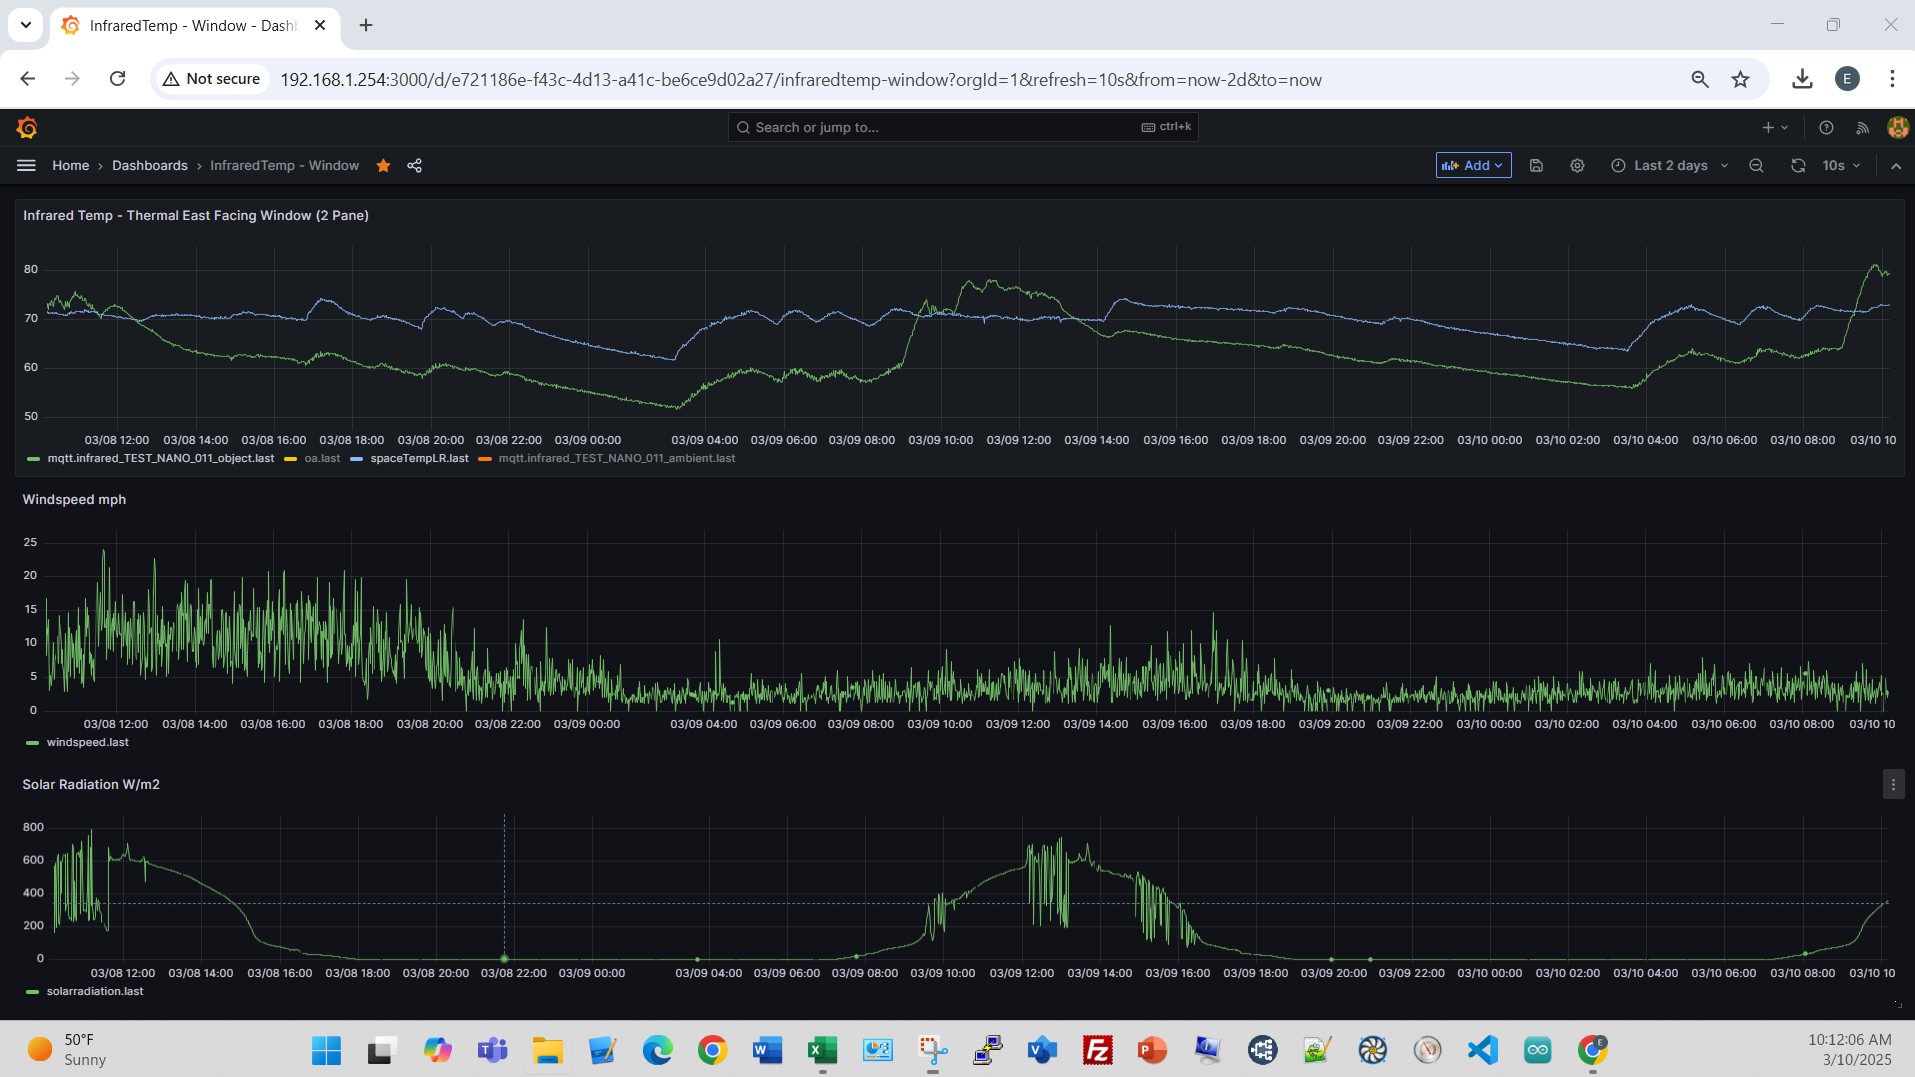
Last 2 days.
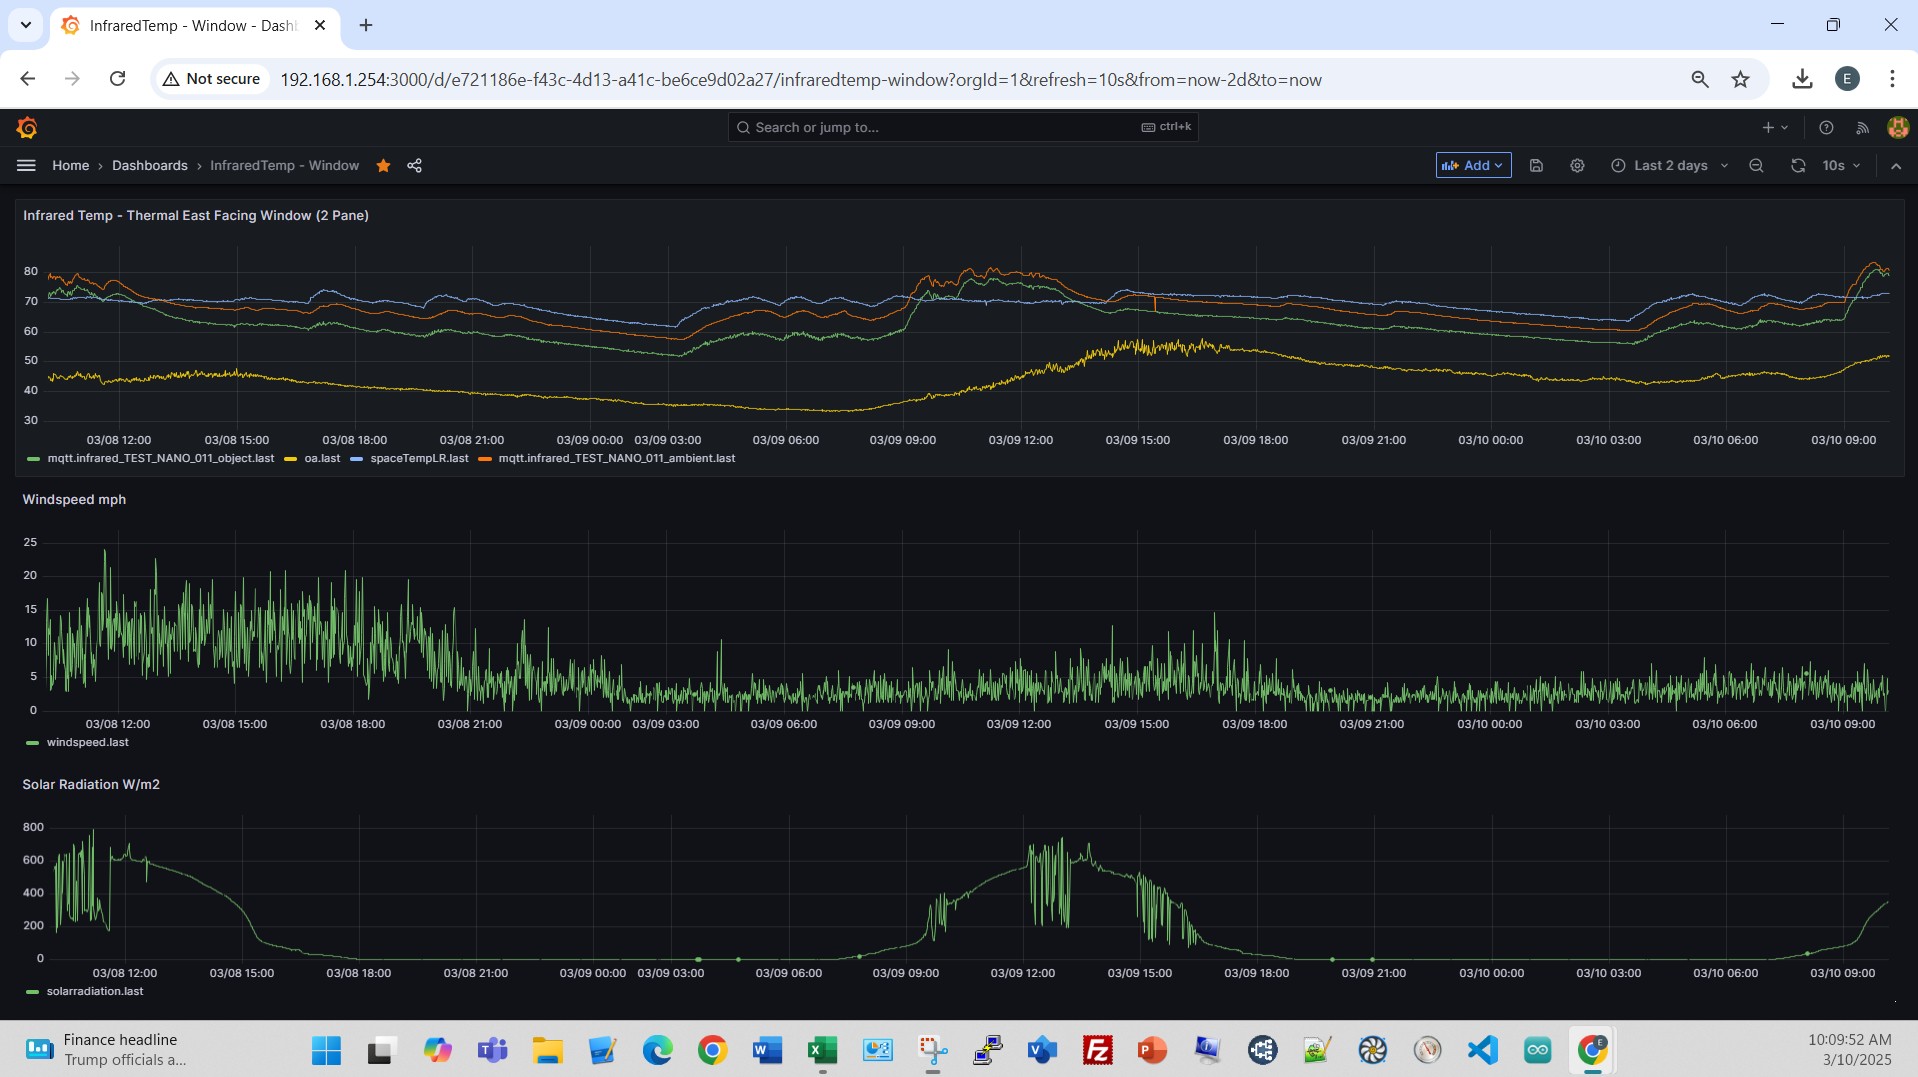
Looking at the last 2 days with a focus on the window and room versus OA temperature.
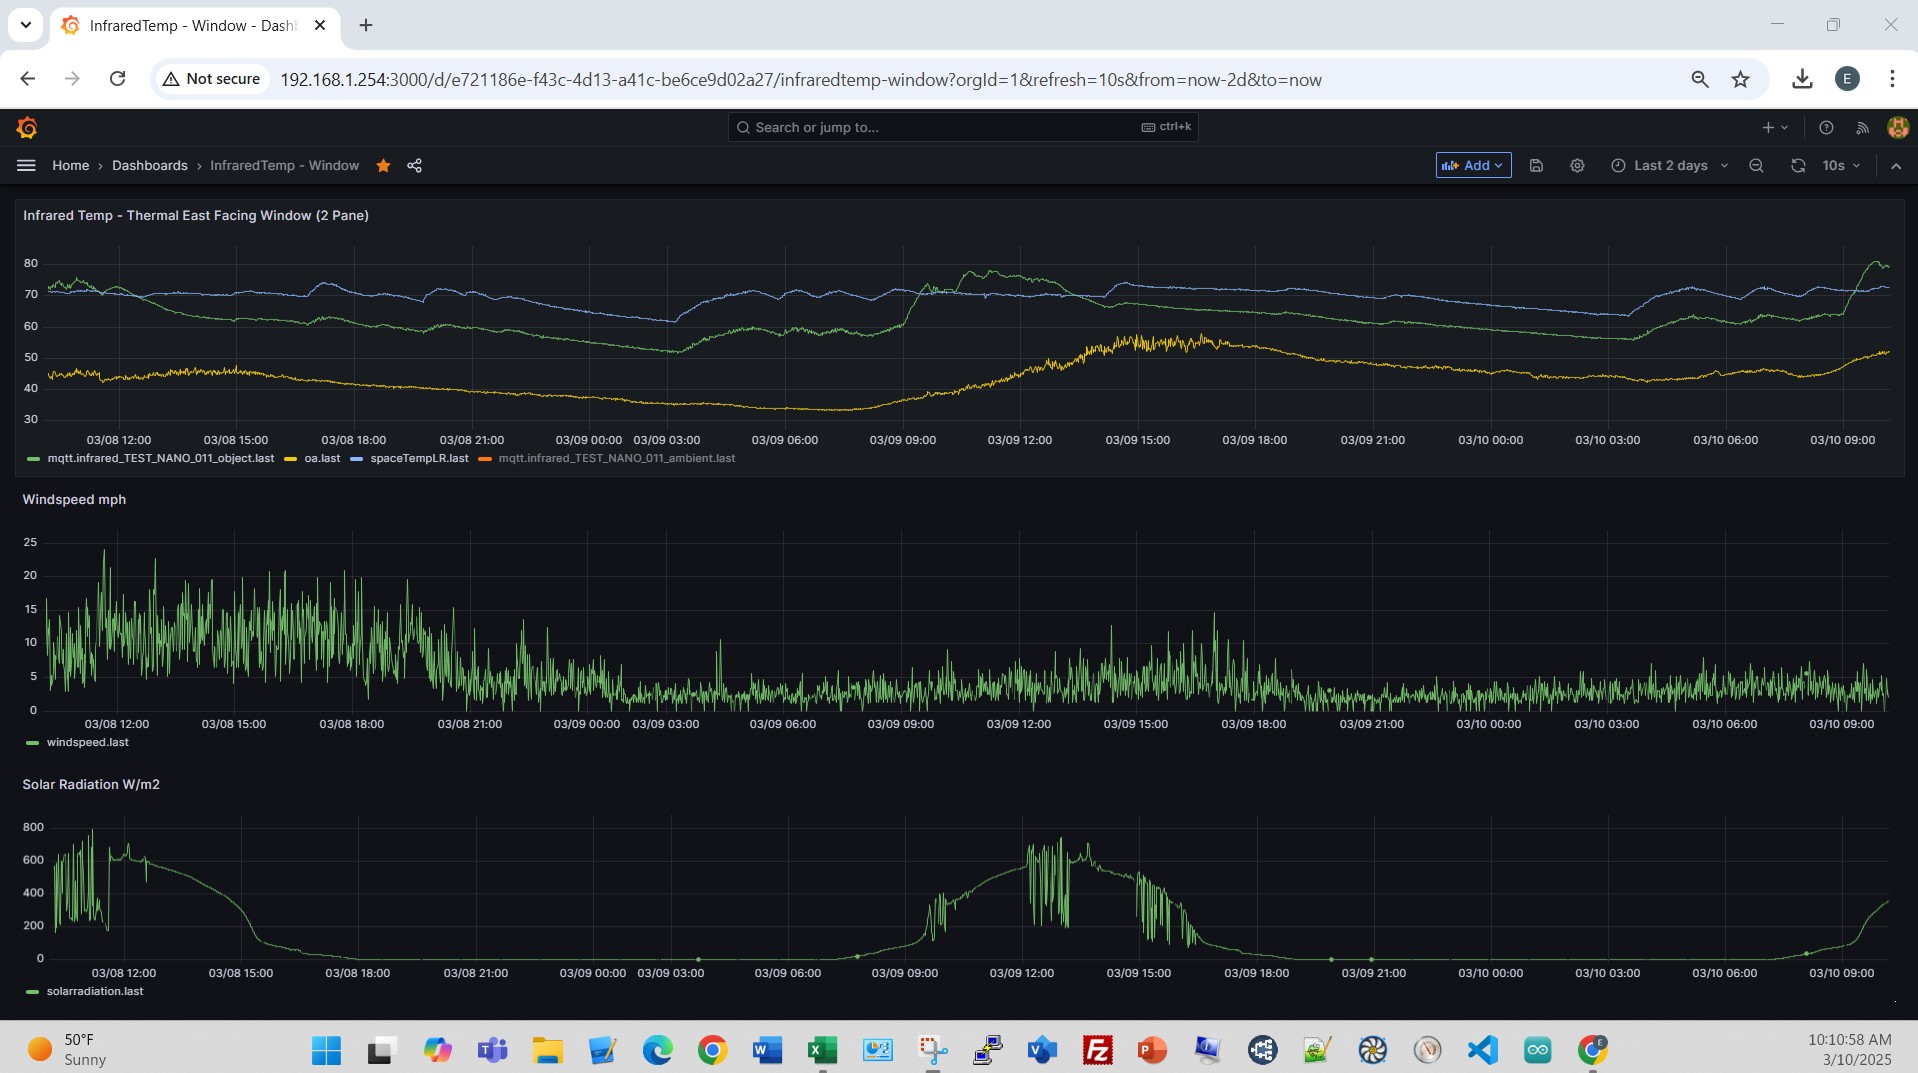
Last 2 days looking at just the window and outdoor air temperatures.
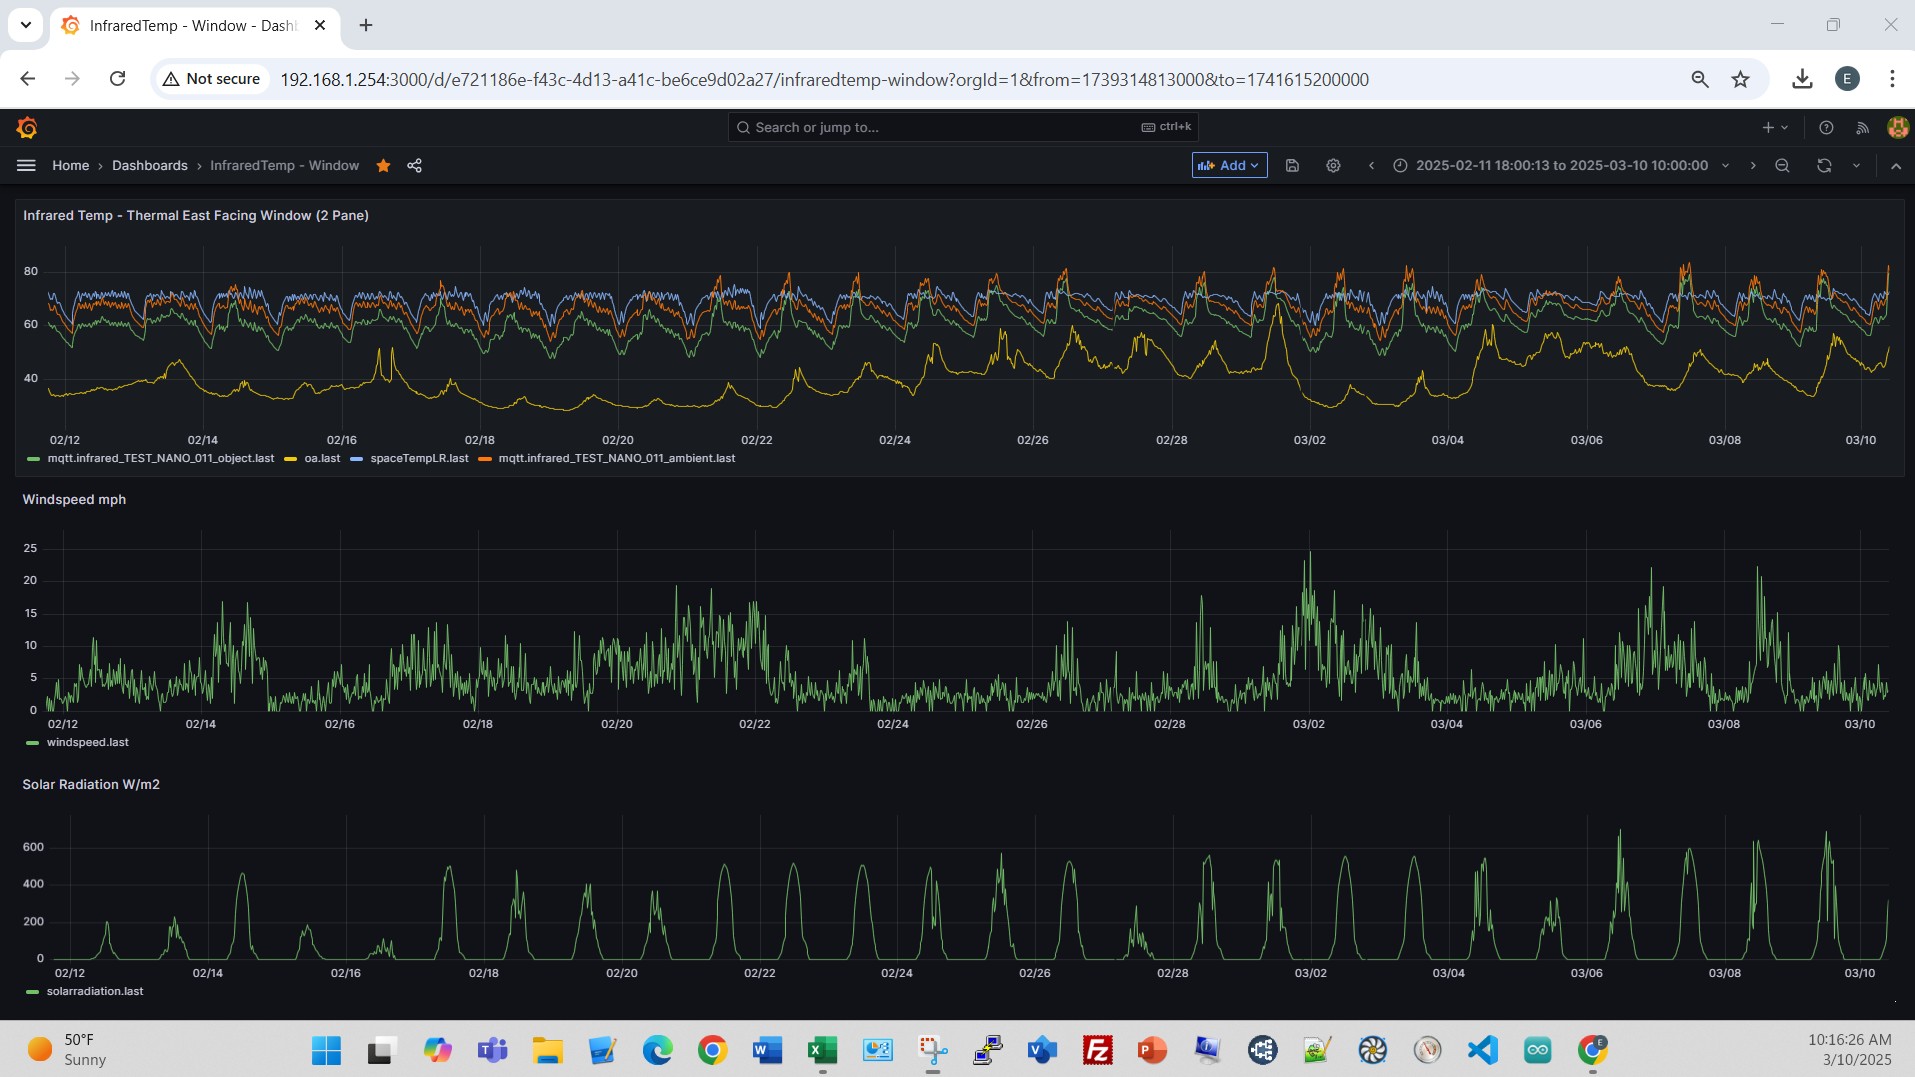
Here’s all the data since the IR probe was aimed at the window on 02/11/25.
And finally, here’s the data with a focus on the window and outdoor air temperatures since 02/11/25.