The EnergyLab LAN continues to develop and expand over time. The graphic below is about 4 months old, since that time many additional devices have been added. I have migrated from Particle Photon’s to Arduino NANO’s. There are now about 20 NANO 33 IOT units serving various purposes from remote wireless sensing, driving OLED displays, to performing complex time-series calculation network engines and generating new data streams.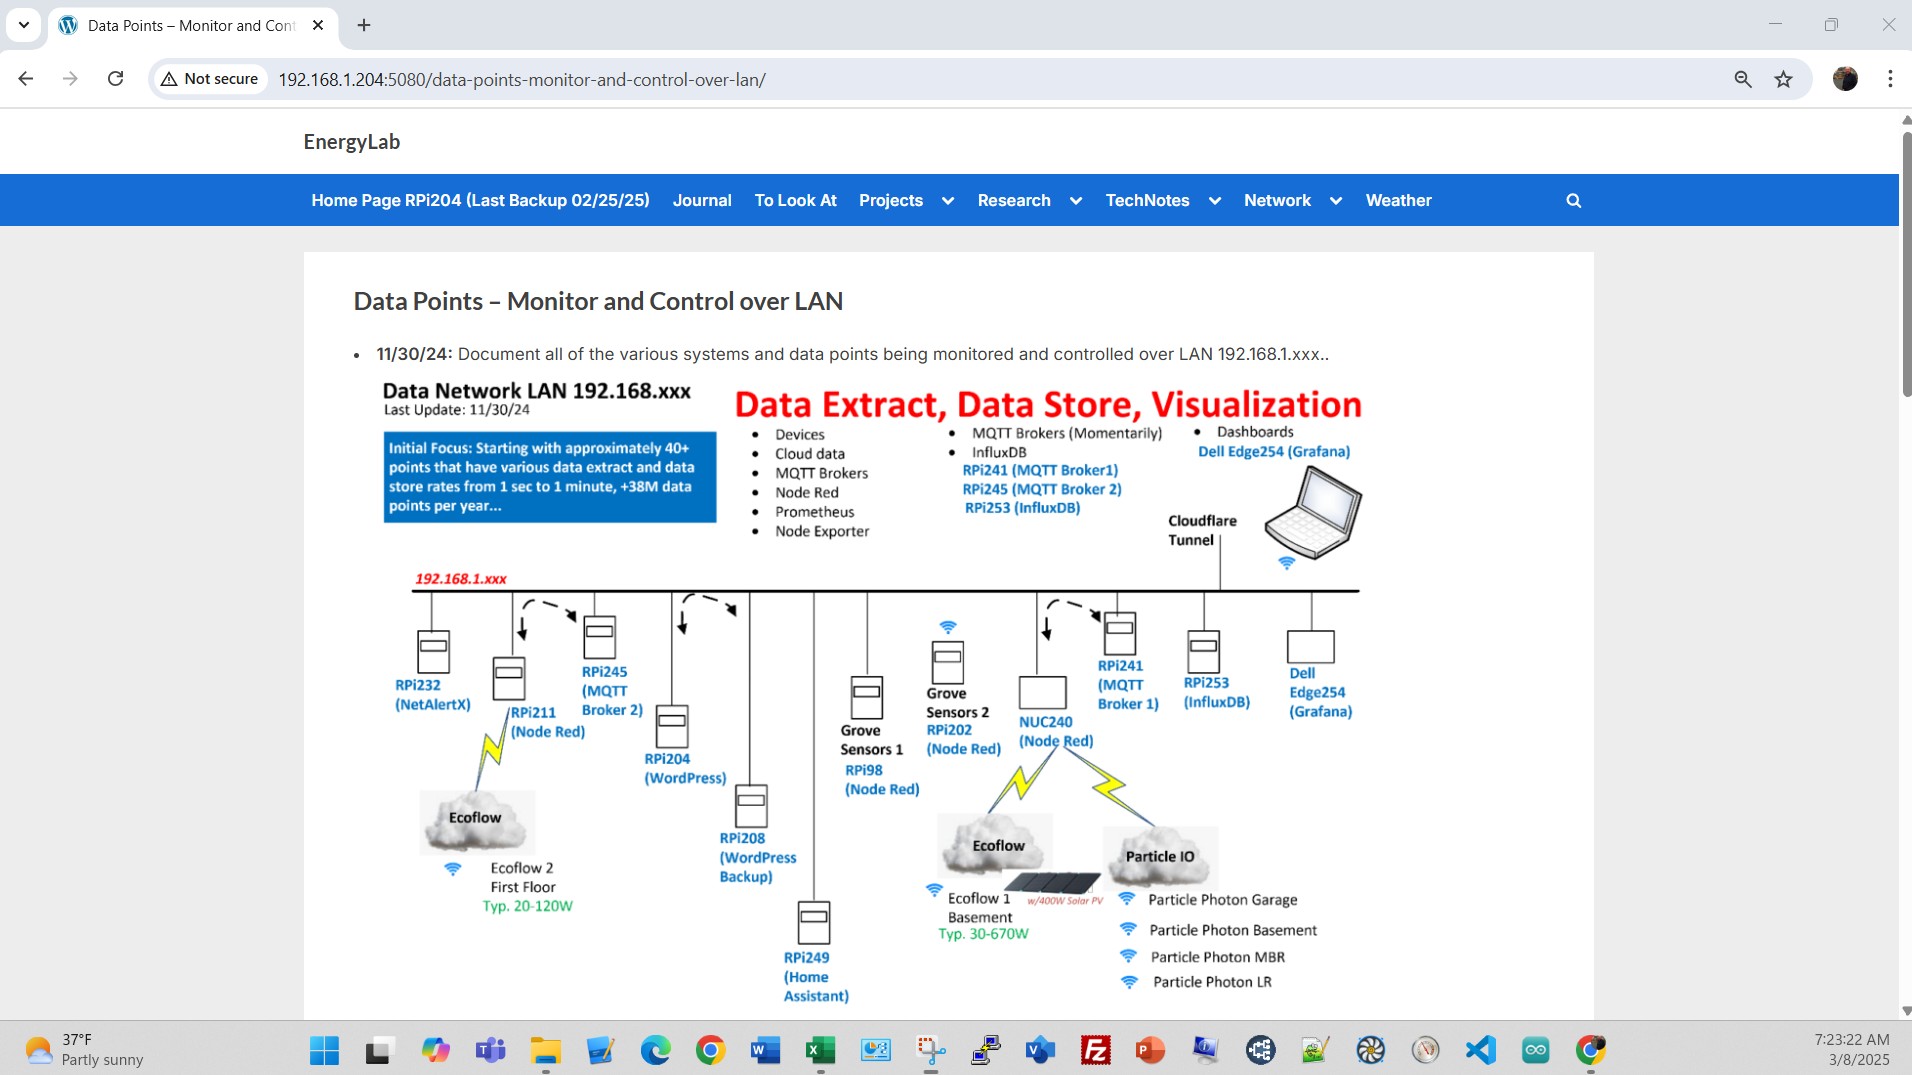
The EnergyLab LAN now has more than 60 network devices on it today as monitored by a RPi running NetAlertX. The network started with just a few RPi’s, a couple of dedicated Linux NUC units, and display devices.
I was impressed by a EcoFlow Portable Power Station I installed to replace an Onan generator in my Chinook RV a few years back. The newer EcoFlow units offered enhanced communications and increased power capacity. I now have two Delta 2 Max units, each has 2,048Wh capacity. One of the EcoFlows has a 400W Renogy portable solar PV array connected it. I’ll describe their functions and time-series dynamic performance in another blog entry but have included an basic example below.
Looking again at the graphic, we have a variety of devices that provide streaming data, i.e. Particle Photons, RPi devices with sensors, EcoFlow units, and in the last couple of months the Arduino NANOs and the Ecowitt weather station. Their scan rates vary from 3-5 points a second to every minute. Prometheus Node Exporter is also running in the background and capturing the performance and load on each computer.
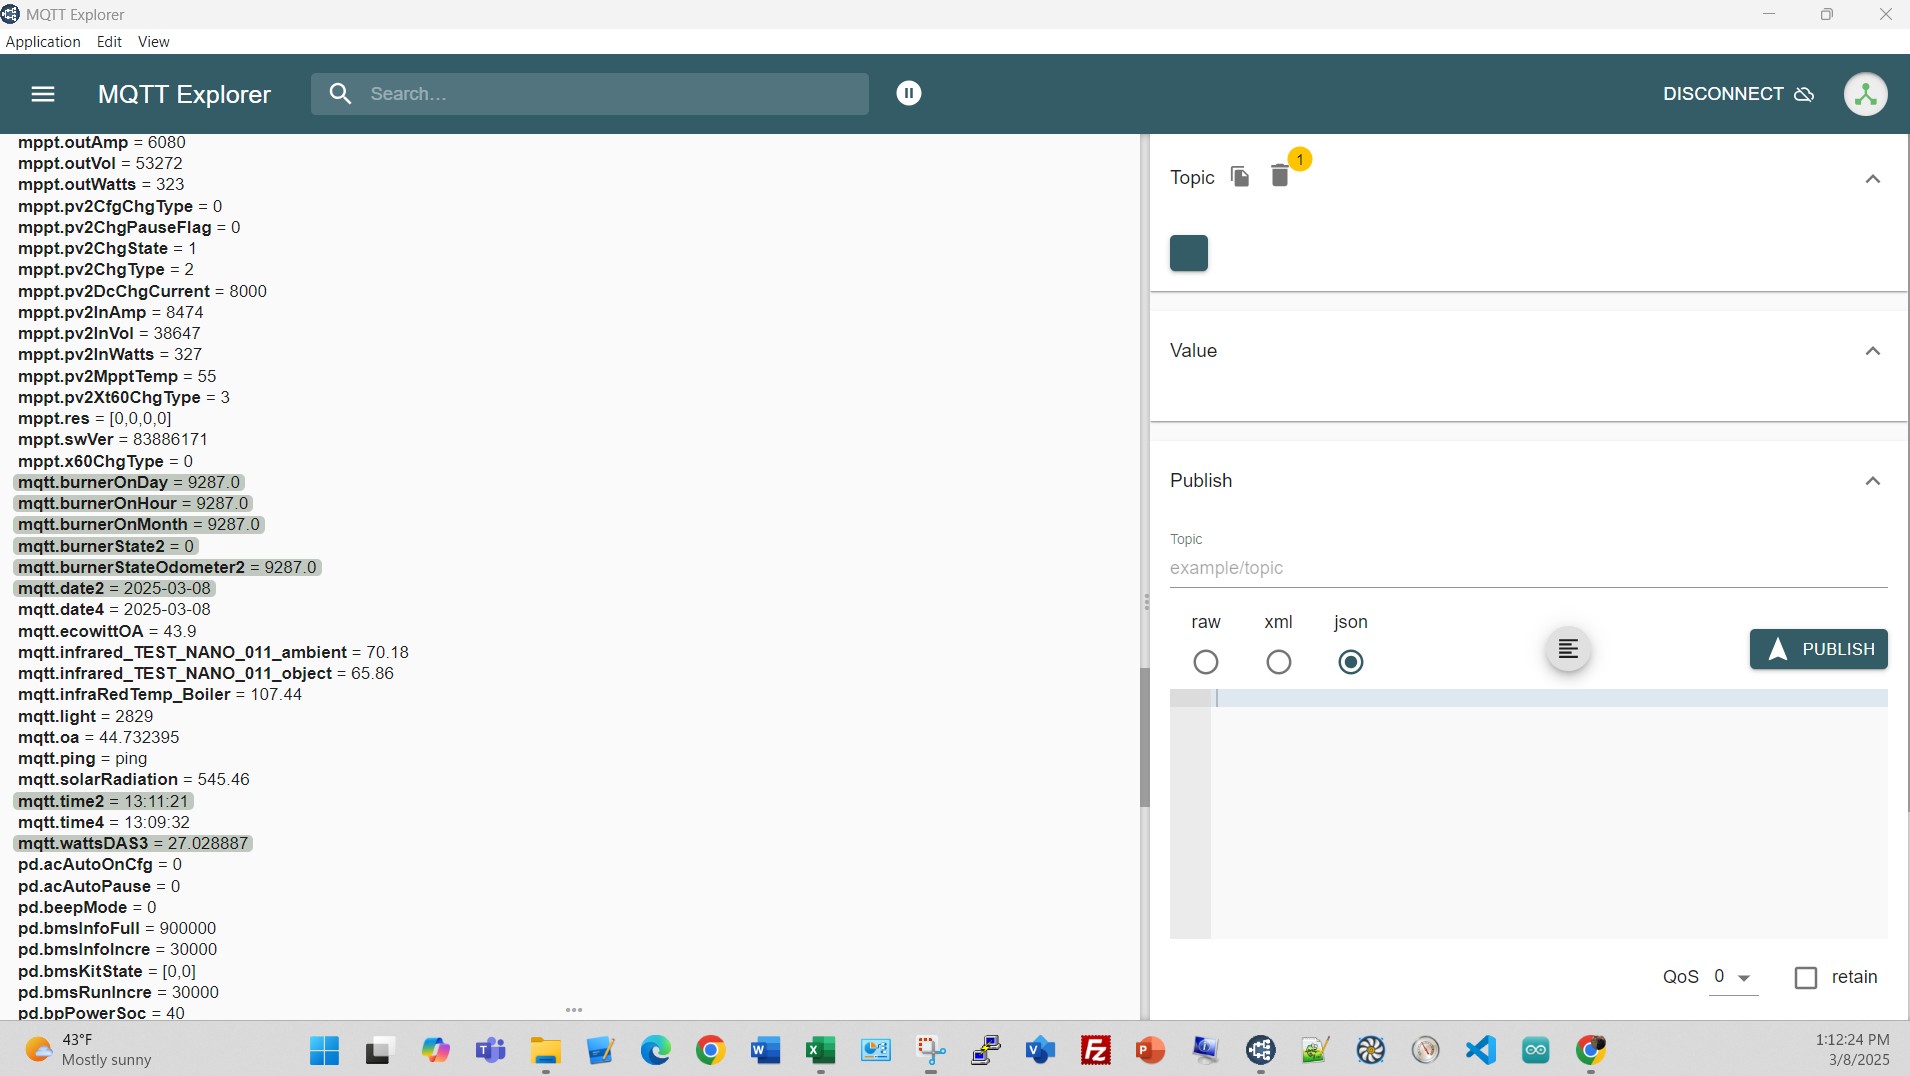
A typical data stream workflow is as shown below. Data stream to Node Red for processing, or directly from the device to one of MQTT brokers running on older generation RPi’s. A example for the EcoFlow with the Solar PV is shown below.
A MQTT broker and MQTT Explorer is a great platform for visualizing and checking on instantaneous time series MQTT data. In the case of the EcoFlow units, Node Red reads a cloud stream via an API from EcoFlow that is updated every second, converts the data to MQTT and also sends the data to an InfluxDB database running on another RPi for long term storage.
The Grafana visualization package is running on a Dell Edge device and takes the InfluxDB data and presents the results in various visualizations on dashboards. Here’s an example of the EcoFlow and solar radiation data from the Ecowitt weather station.
The solar data from the Ecowitt weather station is available at 1 minute intervals, the EcoFlow data is updated every 10 seconds. Looking at the graph below, you can see the Renogy solar PV array started around 7:45A and was producing around 363 watts by 10:56A and 392 watts at 11:05A on Saturday, March 8, 2025 here in the Atlantic Highlands, NJ.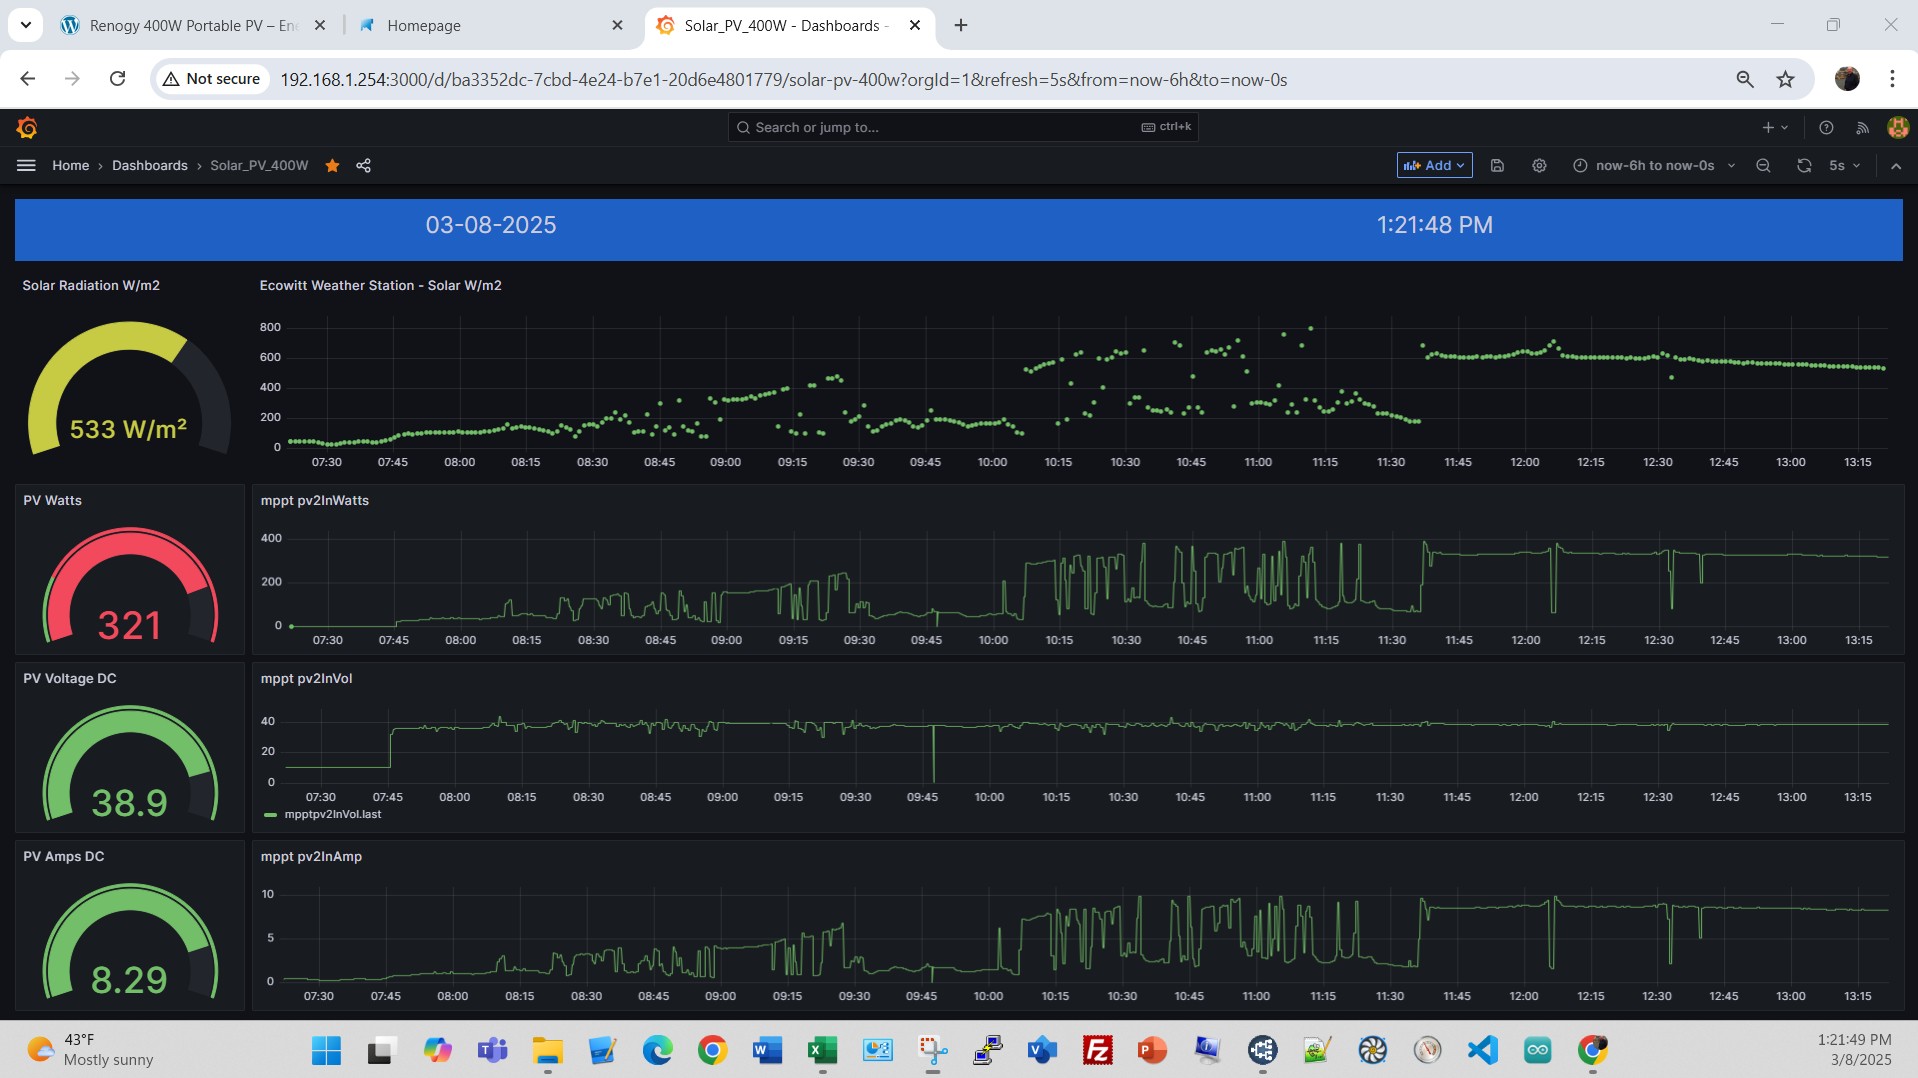
I’ll go deeper into the EcoFlow power station and solar PV setup in the blog entry here.