Using IoT, infrared sensors, and MQTT to track and optimize a multi-zone hot water heating system, January 2025 to now.
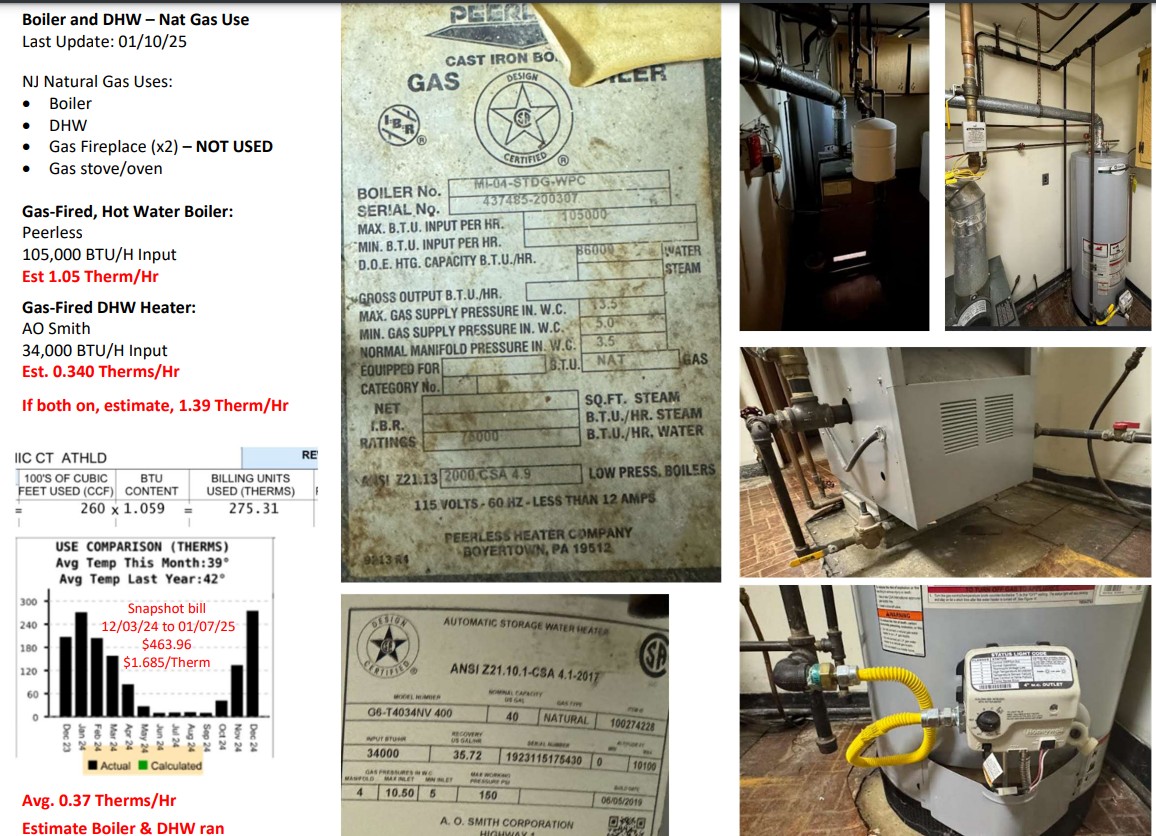
This was an interesting project to reactivate a monitoring system in EnergyLab at a rental home using a multi-channel DAS based based on a Particle Photon I built about 5-6 years ago. The price of natural gas in this area is now about $1.70 a therm so its nice to know ahead of time what the utility bill is going to be.
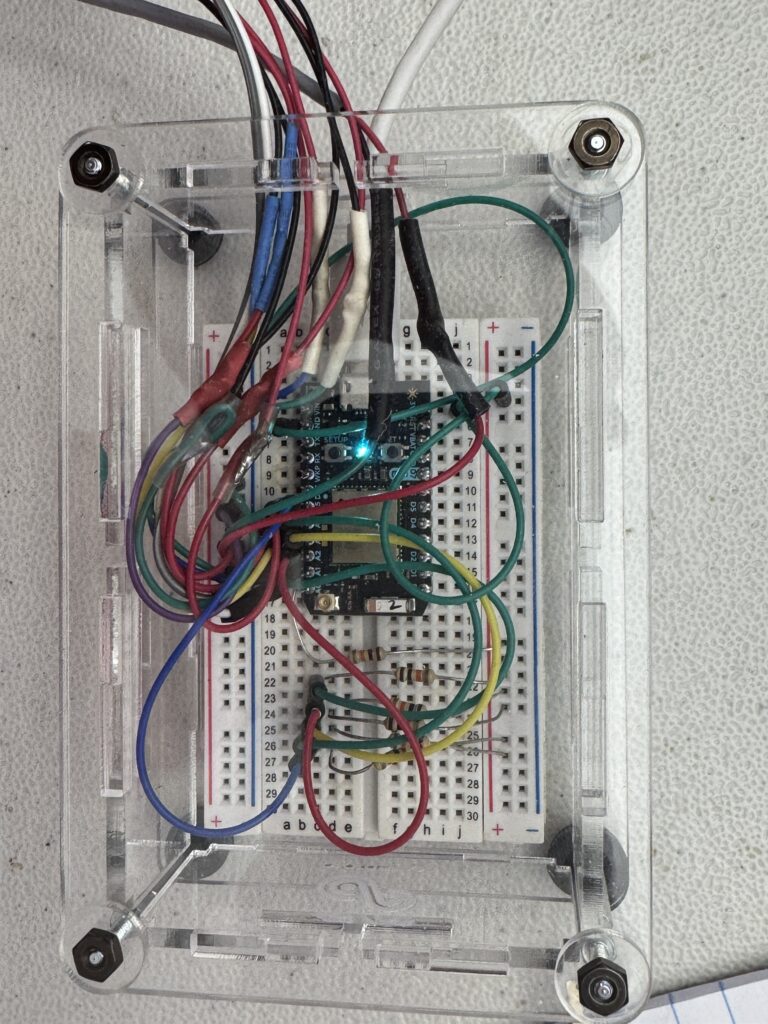
The only real update required was mounting the Particle Photon breadboard with 10K Thermistors going into voltage divider circuits with custom 4th degree polynomial curve fits (from my archives) to provide streaming temperature data in ‘F all mounted in a ProtoStax enclosure as shown below.
These are the monitoring points that are read on the first generation Particle Photon and sent every minute to the Particle Cloud. The temperature sensing is via strap on 10K thermistors and the burner monitoring is made via a CAD cell. Zone 1 and 2 have NEST thermostats. Zone 3 has a Honeywell Clock thermostat that was replaced during the project.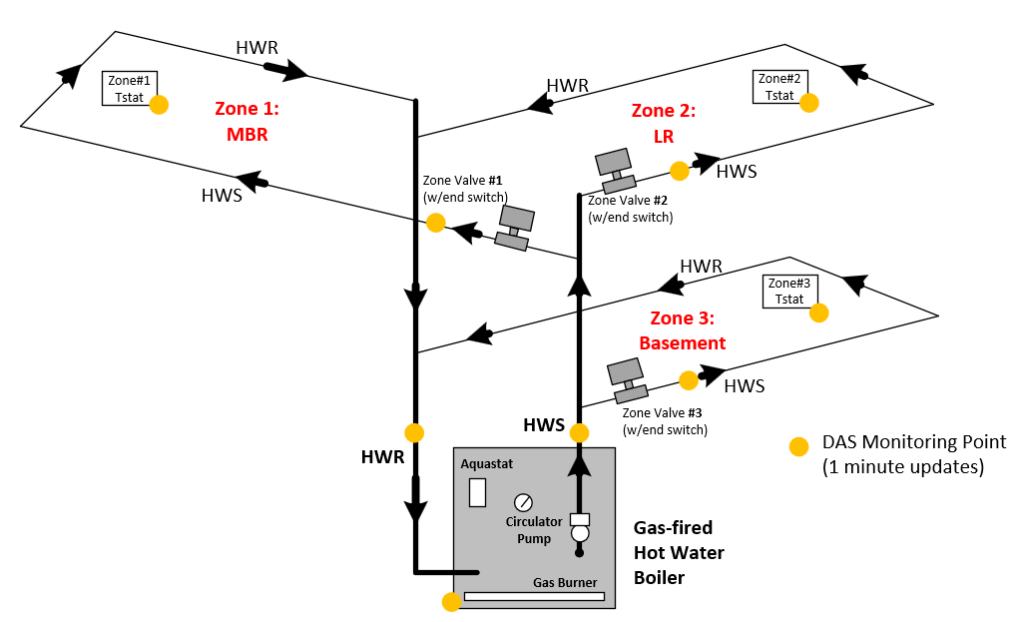
The system operation is pretty basic for the gas-fired hot water boiler with three thermostats, 3 zone valves, 1 circulator pump and aquastat set to 170’F (low setting since lots of fin tube radiation here). DHW is provided by a separate gas-fired unit.
Sequence: Thermostat calls for heat, zone valve opens, end switch in the zone valve activates the boiler and circulator pump, aquastat monitors and controls boiler temperature by turning the burner on and off to maintain a 10’F differential (ON at 160’F, OFF at 170’F), when the thermostat is satisfied the burner end switch releases cutting off water flow to that zone, if none of the other zones are calling for heat, the boiler will remain off till the next call for heat.
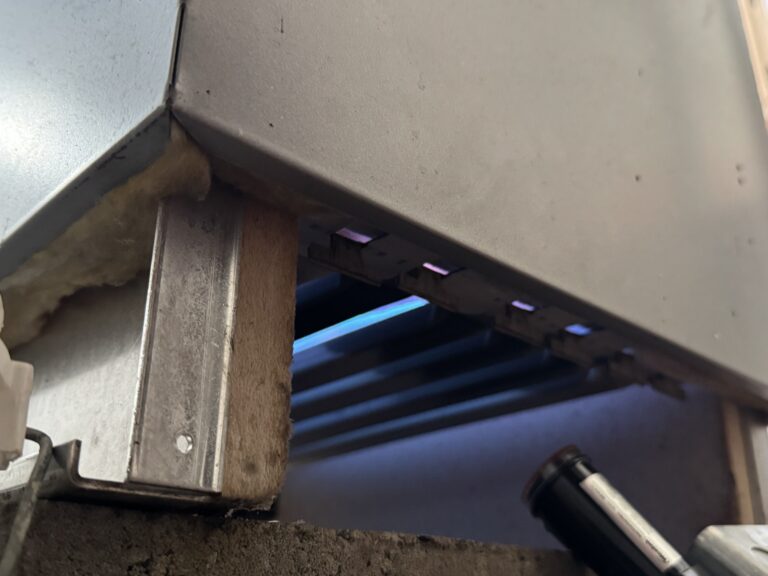
The installation photo below shows a bit of the complexity using wired sensors. The photo also has a new infrared stack sensor I’ve built that is connected to an Arduino NANO 33 IOT. I’ll describe how that project works versus the CAD sensor in my next blog posting.
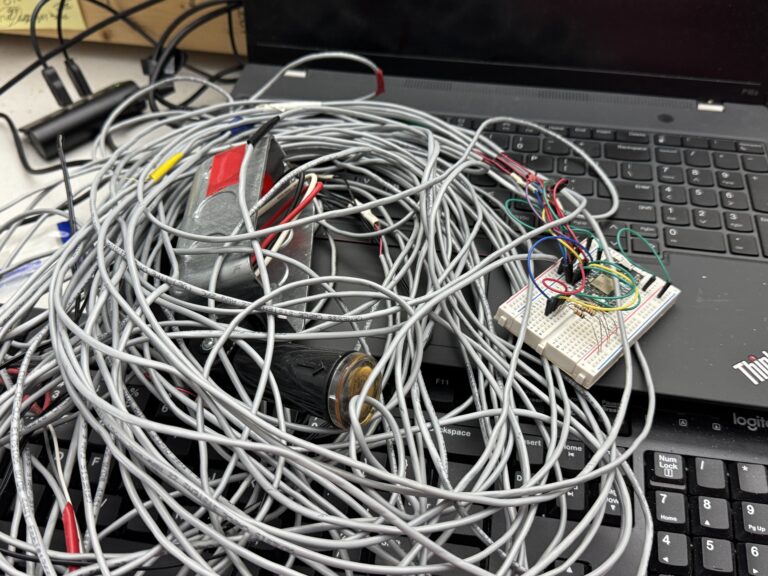
Here the CAD cell aimed at the boiler firebox while the gas burner is operating.
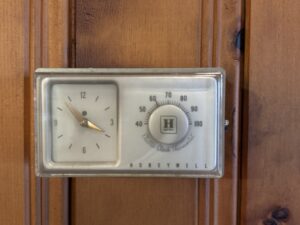
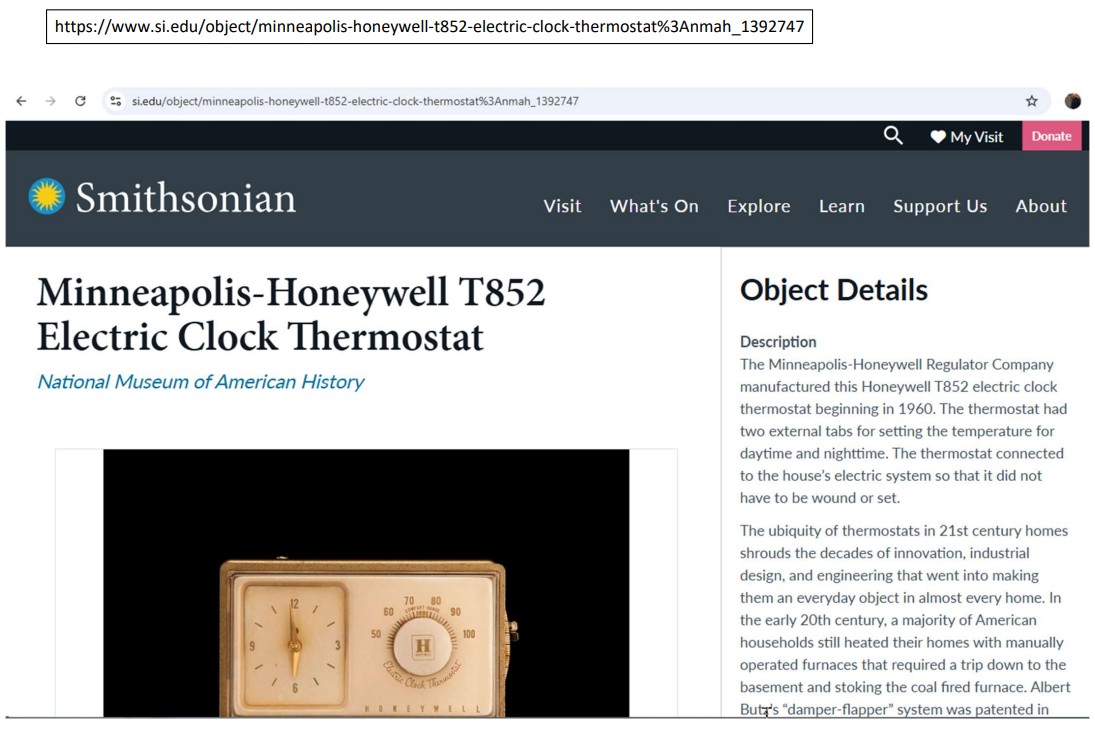
An antique Honeywell T852 thermostat on Zone 3 was operating as fixed setpoint and after 50+ years was starting to fail with very wide inefficient temperature swings. It was replaced with a new day/night thermostat as shown below.
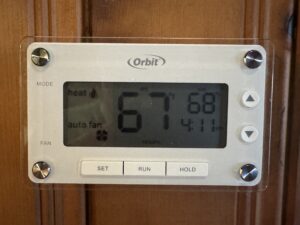
A very basic, low cost $40, day/night Orbit 83521 thermostat was purchased from Amazon and installed on 01/14/25 at 5PM to see how it works versus the NEST $150-180 units.
So from this point, all the equipment is installed, and a few RPi’s running Node Red, MQTT broker, InfluxDB and Grafana come into action with these one minute data streams. Here’s what a bit of the Node Red function block looked like. It took a few trial and error iterations to dial in the inference engine to use the flame signal to infer if the gas burner was off or on.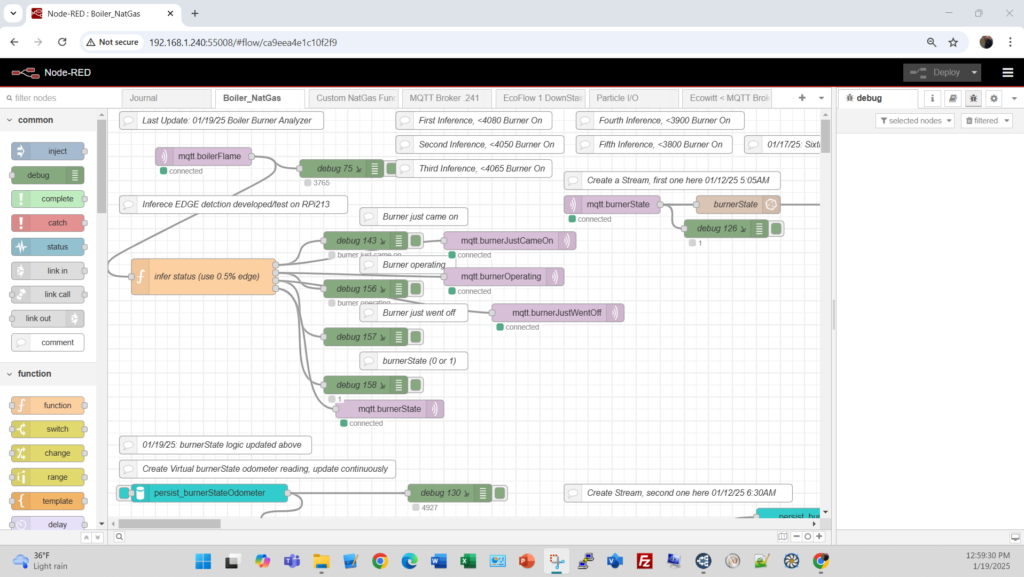
The purple boxes are MQTT data points, the dark brown are MQTT points being sent to one of the InfluxDB databases.
Now here are a few of the Grafana data time-series displays. As you can imagine from the sequence described above, these data plots will be interesting. The left side of the screen is the gas burner flame signal, inferred status of the burner from the signal and an estimate rollup of how many minutes each hour the burner ran. From this type of data you can estimate natural gas use in therms based on the boiler size using this run time data for each hour.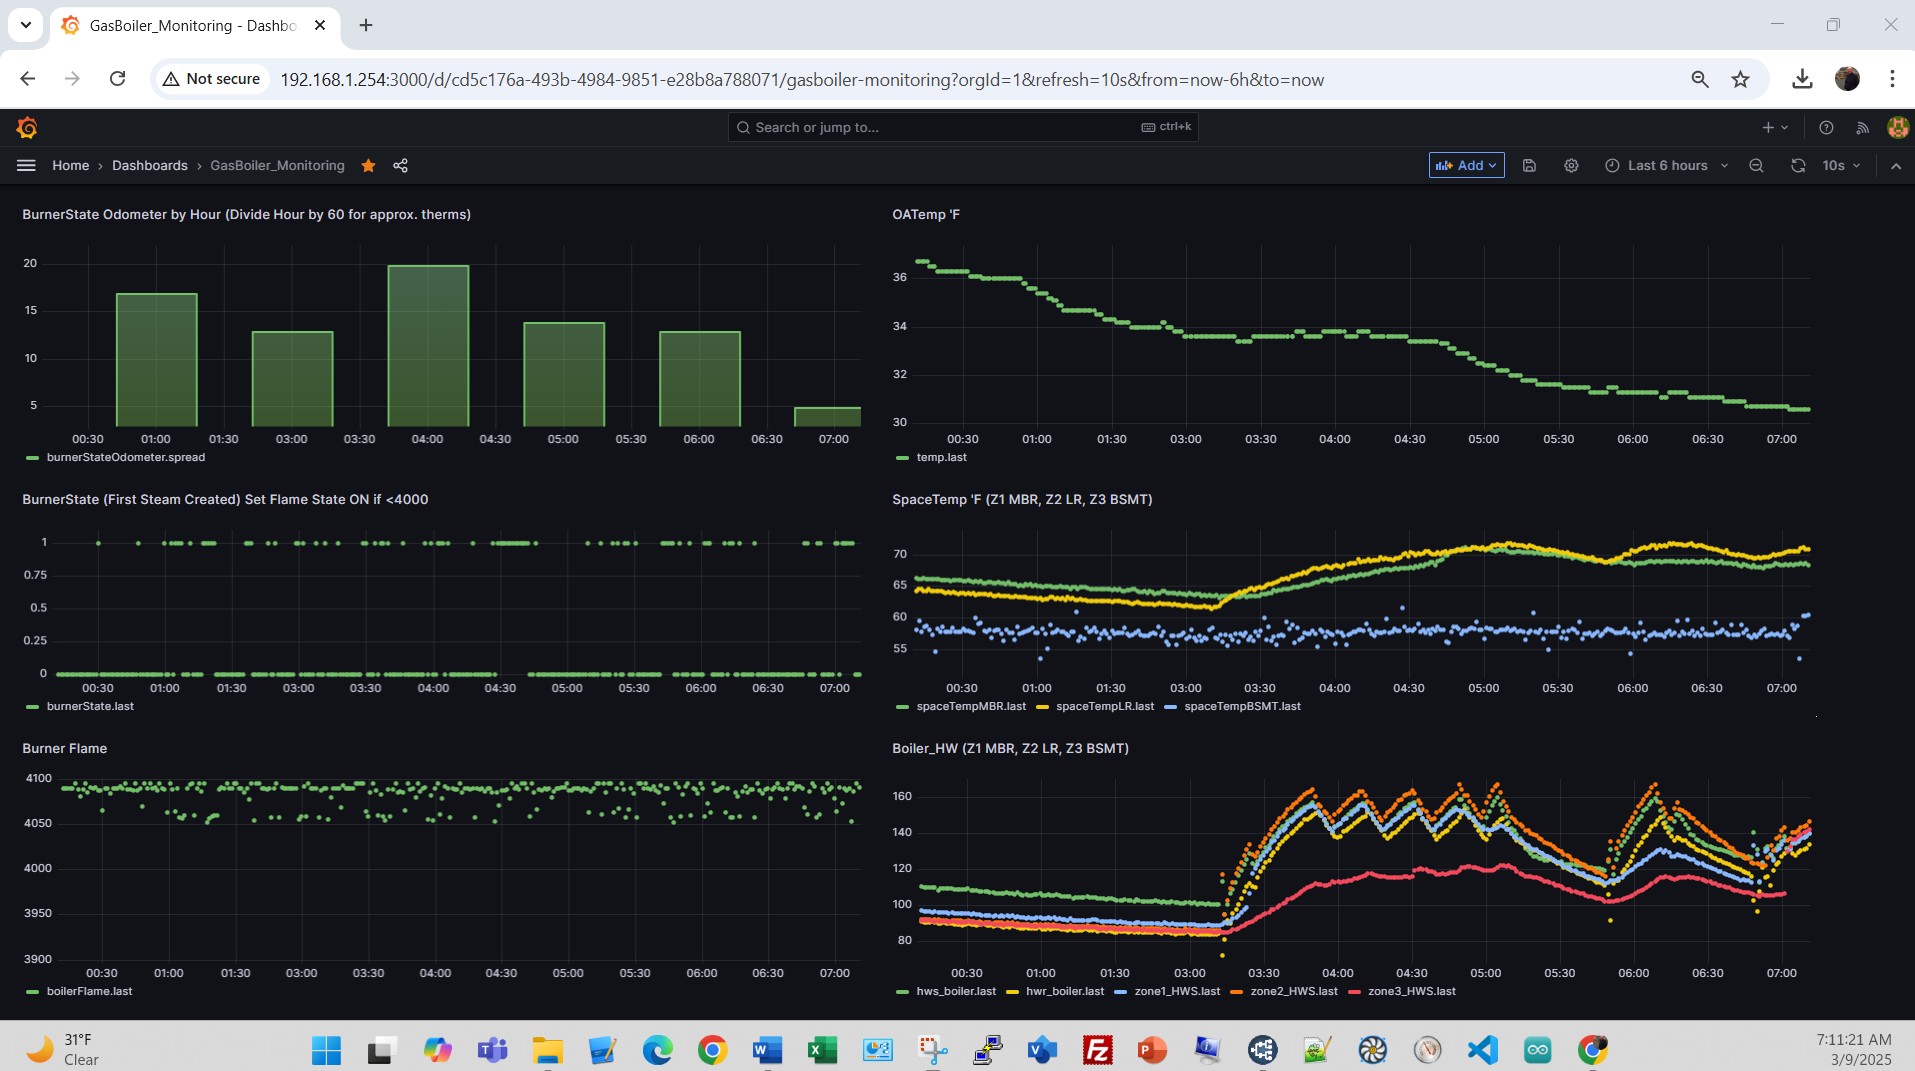
The right side has the outdoor air temperature, zone temperatures (wireless Particle Photon and Arduino NANO devices with 10K thermistors) and the boiler hot water supply and return loop temperatures and each zone temperature.
Additional Grafana graphs can be made on any of the MQTT data stored in the InfluxDB database.Here’s a view of what this graph looks like today, Sunday 03/09/25 at 8:10AM for the last 24 hours. 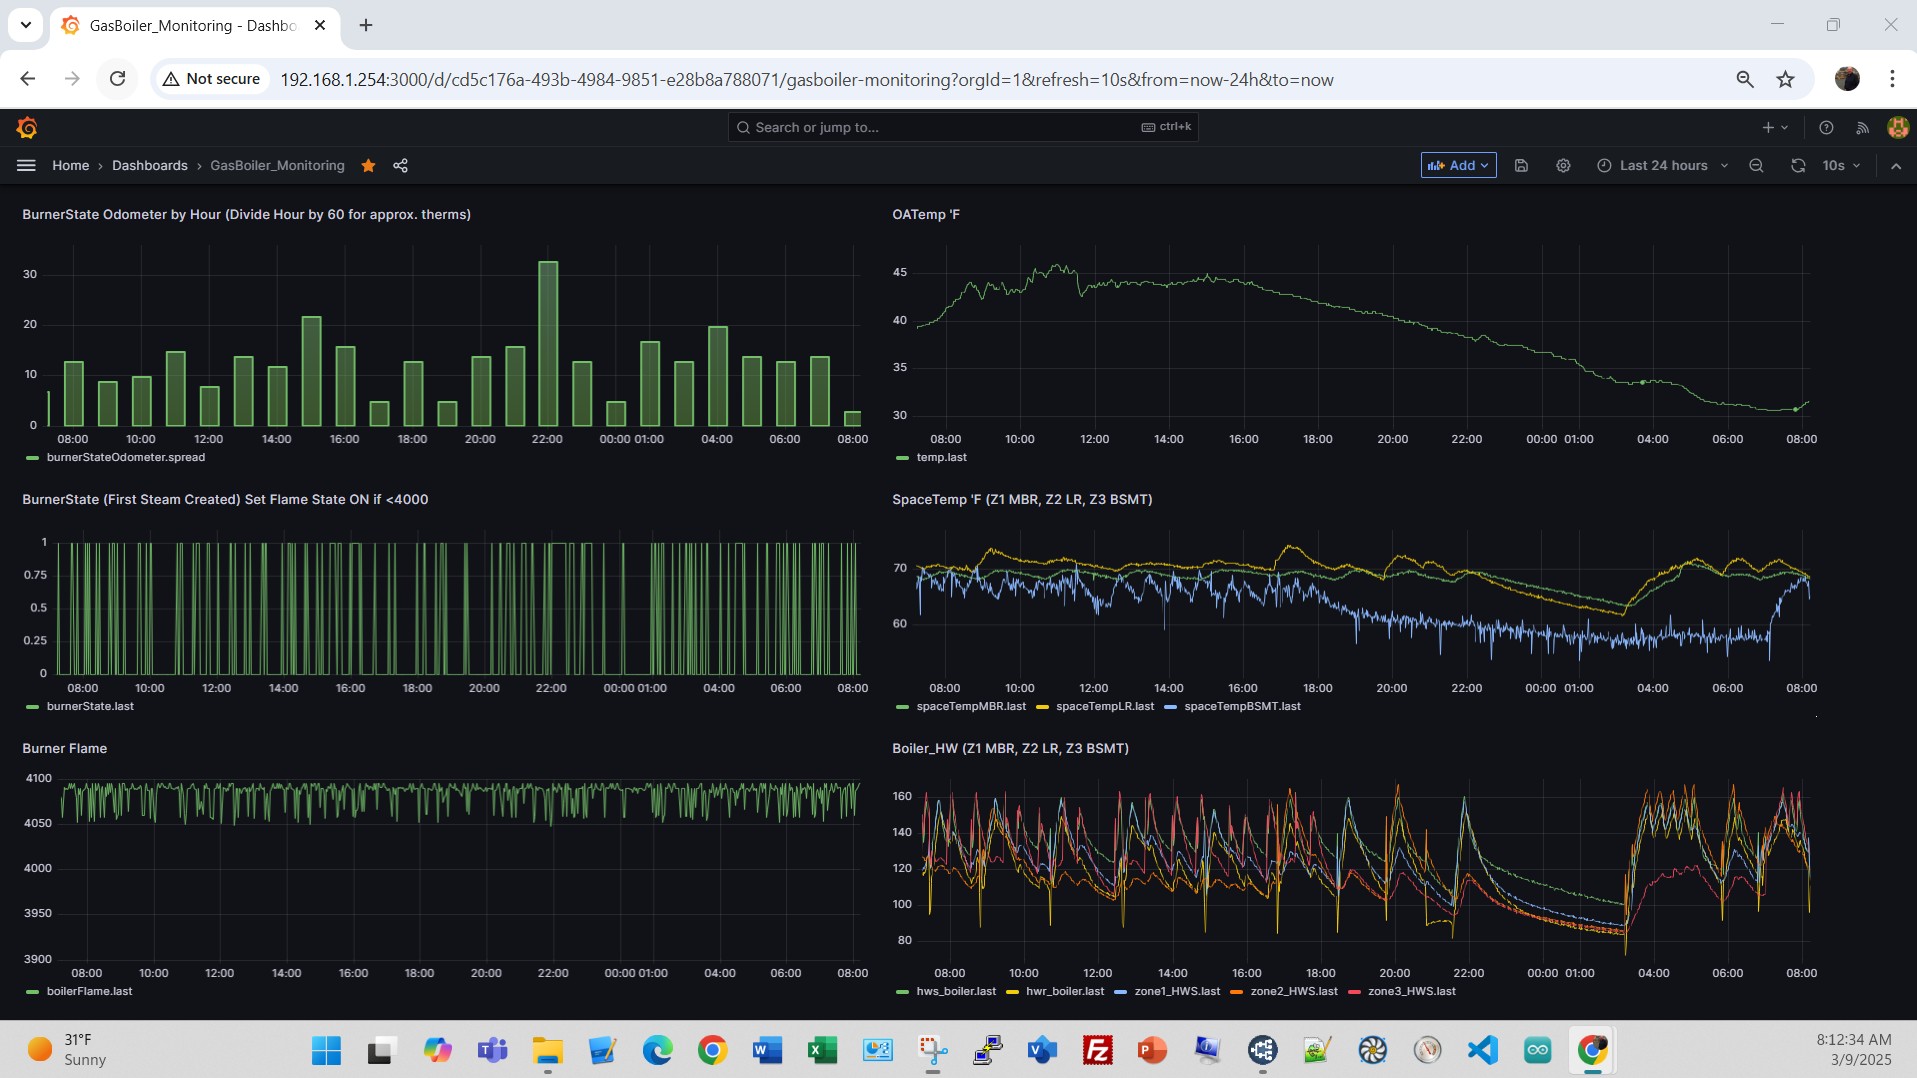
Looking closer, for the last 3 hours. The left side shows the burner running for about 12 to 14 minutes each hour. The right side shows the OA was in low 30’s. You can also see the night setback on zones 1 (LR), 2 (MBR) and 3 (basement). Interesting to see that DST started today, the NESTs automatically updated their clock, whereas the basic Orbit day/night thermostat did not.
The boiler temperature dropped overnight to around 90’F, and around 5:45AM the NEST thermostats (Zones 1 & 2) went from night to day settings (i.e. unoccupied to occupied). The basement Zone 3 did this at around 7A, since it did not know DST started today. Looking at Space temperature and boiler and loop temperatures you can see the various interactions and response times.
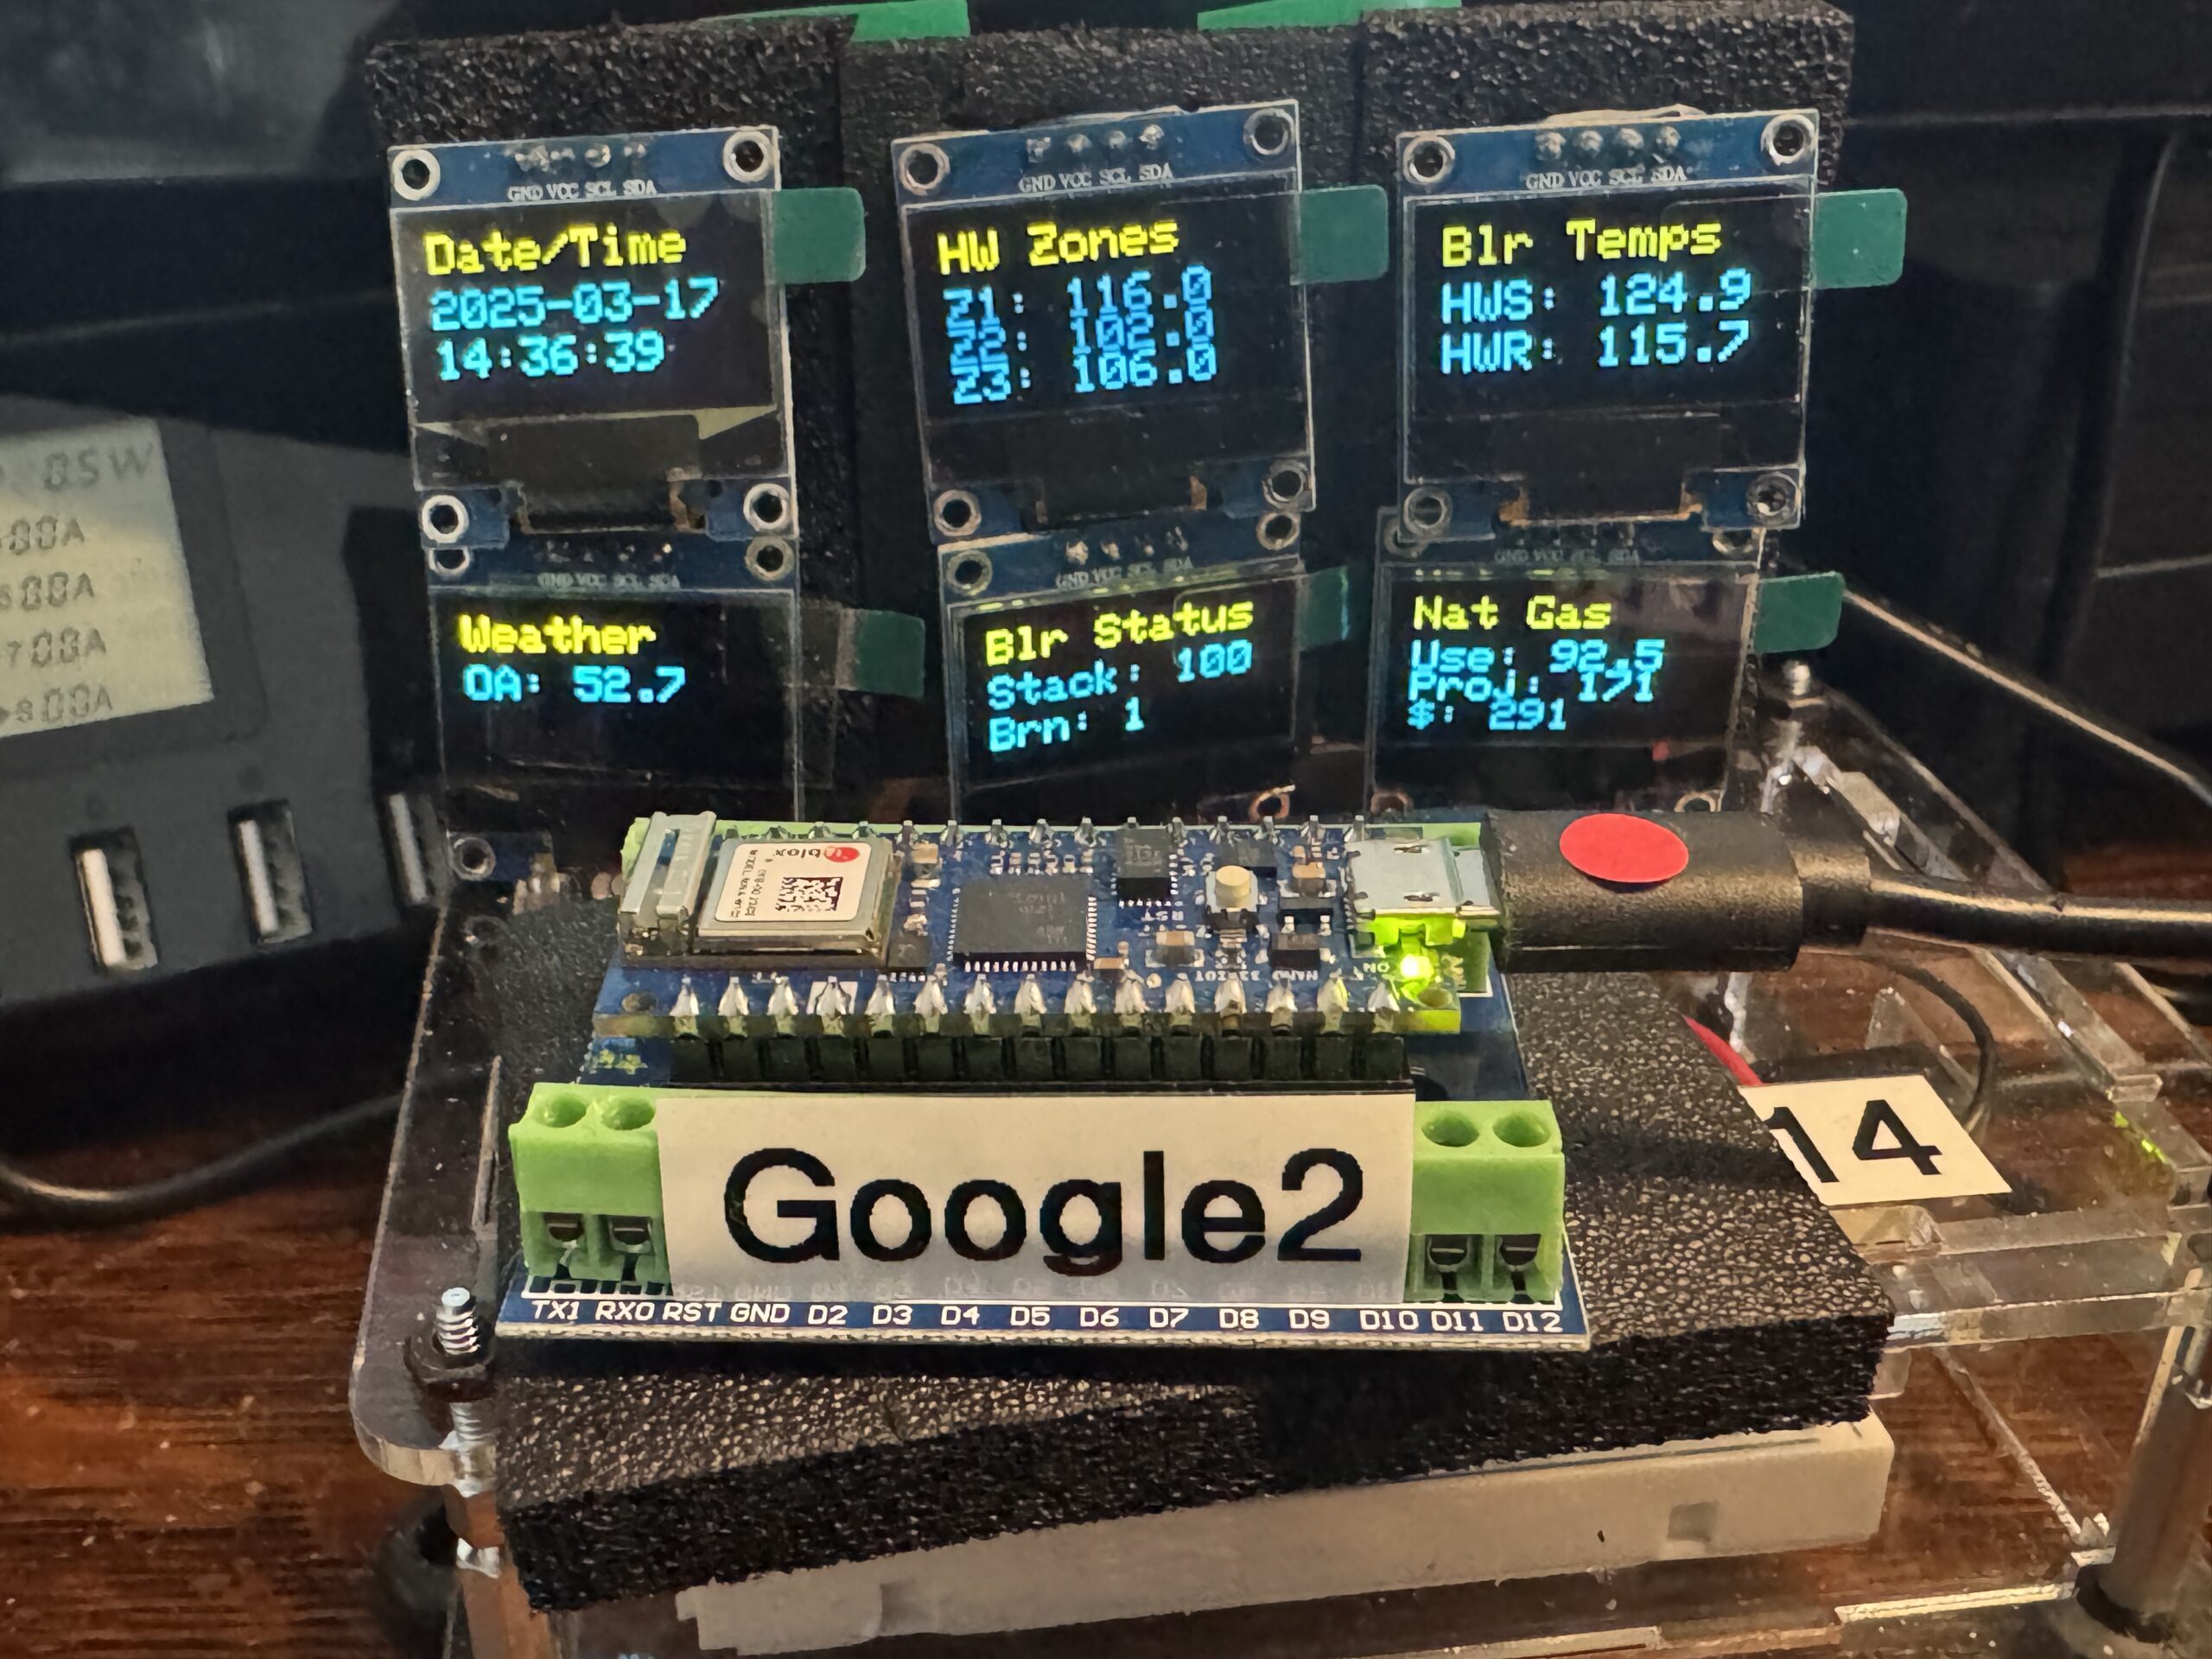
The Arduino NANO’s are great little devices $25, especially when coupled with low cost OLED $3 displays showing MQTT broker project data like this.
I continue to work on this project and will be upgrading from CAD sensor to Infrared Stack temperature sensor for natural gas burner detection here.